


period

Mathematics, 16.10.2020 15:01, triddi666
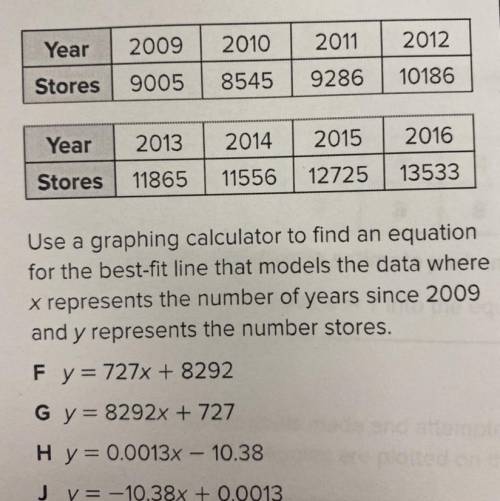
4 The table shows the number of stores owned
by a popular coffeehouse over an 8-year
period
Year
2009
9005
2010
8545
2011
9286
2012
10186
Stores
2013
2016
Year
Stores
2014
11556
2015
12725
11865
13533
Use a graphing calculator to find an equation
for the best-fit line that models the data where
x represents the number of years since 2009
and y represents the number stores.
F y = 727x + 8292
G y = 8292x + 727
Hy = 0.0013x - 10.38
Jy = -10.38x + 0.0013

Answers: 1
Other questions on the subject: Mathematics
Mathematics, 22.06.2019 02:30, jdkrisdaimcc11
The gdp is $1,465.2 billion. the population is 249,793,675. find the per capita gdp.
Answers: 1
Mathematics, 22.06.2019 03:00, jjgurl60
Ashley spent half of her lunch money on a turkey sandwich. then she spent two-thirds of the money she had left on a bottle of juice and the rest of the money on a cookie. if the cookie cost $.75, how much lunch money did ashley have to start with?
Answers: 2
Do you know the correct answer?
4 The table shows the number of stores owned
by a popular coffeehouse over an 8-year
period
period
Questions in other subjects:


Biology, 07.07.2019 03:10

Biology, 07.07.2019 03:10
Mathematics, 07.07.2019 03:10


