

Mathematics, 16.10.2020 19:01, angeisthe72
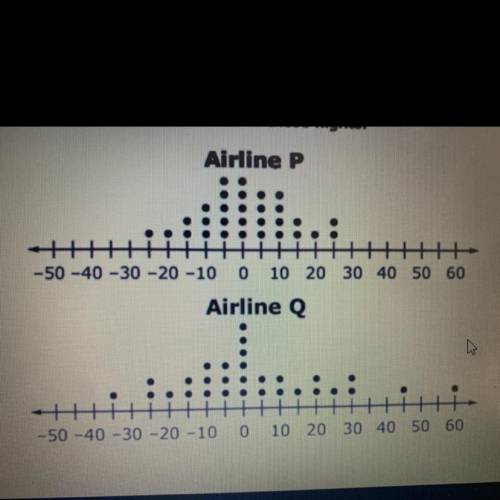
Two airlines each made 30 flights. The dot plots shown compare
how many minutes the actual arrival times were before or after
the scheduled arrival times of these flights.
Negative numbers represent the minutes the flight arrived before its scheduled time.
Positive numbers represent the minutes the flight arrived after its scheduled time.
Zero indicates the flight arrived at its scheduled time.
Assuming you want to arrive as close to the scheduled time as possible, from which
airline should you buy your ticket? Justify your response by addressing both the
measures of center and spread of the distributions.

Answers: 2


Other questions on the subject: Mathematics
Mathematics, 21.06.2019 14:00, kassidyopry15
The table shows the distance traveled over time while traveling at a constant speed.
Answers: 1
Do you know the correct answer?
Two airlines each made 30 flights. The dot plots shown compare
how many minutes the actual arrival...
Questions in other subjects:

Spanish, 23.08.2019 01:30
Mathematics, 23.08.2019 01:30


History, 23.08.2019 01:30

Mathematics, 23.08.2019 01:30
Mathematics, 23.08.2019 01:30


