


The graph shows how the mass of copper
changes as the volume of the element changes
and the d...

Mathematics, 16.10.2020 09:01, chloeholt123
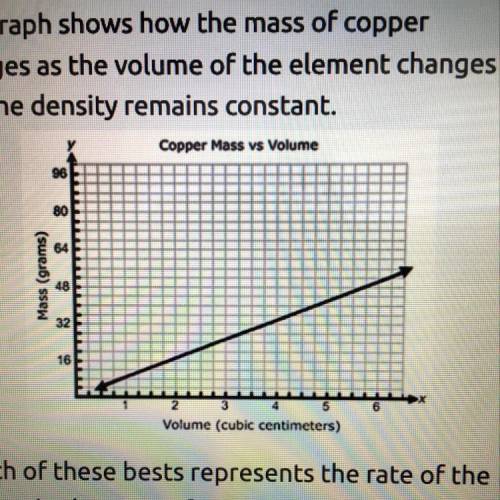
The graph shows how the mass of copper
changes as the volume of the element changes
and the density remains constant.
*picture*
Which of these bests represents the rate of the
change in the mass of copper with respect to the
volume?
a.4/33 g/cm^3
b.19/41 g/cm^3
c.8 1/4 g/cm^3
d.4 4/7 g/cm^3

Answers: 3
Other questions on the subject: Mathematics
Mathematics, 21.06.2019 15:30, dolliemeredithm
Guests at an amusement park must be at least 54 inches tall to be able to ride the roller coaster. which graph represents the set of heights that satisfy this requirement?
Answers: 3
Do you know the correct answer?
Questions in other subjects:


