

Mathematics, 16.10.2020 07:01, elizabeth15ovando
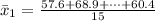
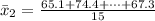
An environmental engineer is tasked with determining whether a power plant cooling system is heating the water it uses more than allowed by environmental regulations. They measure water temperatures at the cooling system input and the cooling system output for several different days in several different seasons. A list containing these measurements is below:
Sample Input Temp (deg F) Output Temp (deg F)
1 57.6 65.1
2 68.9 74.4
3 68.1 74.7
4 47.7 55.4
5 48.1 51
6 67.2 71.9
7 69.9 79.2
8 48.1 57.2
9 35 41.4
10 56 61
11 44.3 50.8
12 65 70.5
13 48.3 56.9
14 54.9 61.7
15 60.4 67.3
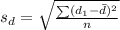
Do a statistical analysis on this data to determine if the temperature change between the input and output of the cooling system is different than 6 degrees.
1. What does your analysis indicate?
a. The cooling system changes the temperature of the water by an amount different than 6 degrees.
b. The cooling system changes the temperature of the water by 6 degrees.
2. What is the P-Value associated with your decision above?
a. 0.001
b. 0.026
c. 0.049
d. 0.070
e. 0.110
f. 0.131
g. 0.148
h. 0.201
i. 0.278
j. 0.289

Answers: 1


![s_d = \sqrt{\frac{([57.6- 65.1]- 6.6)^2+ ([68.9 - 74.4]- 6.6)^2 + \cdots + ([60.4 - 67.3]- 6.6)^2 }{15} }](/tpl/images/0809/5811/66499.png)
![s_d = 1.732 [/texGenerally the test statistics is mathematically represented as [tex]t = \frac{ d - \= d }{ \frac{s_d}{\sqrt{n} } }](/tpl/images/0809/5811/baae3.png)


 hence
hence 


Other questions on the subject: Mathematics
Mathematics, 21.06.2019 18:40, elleinad5656
What dimensions can créate more than one triangle ?
Answers: 1
Do you know the correct answer?
An environmental engineer is tasked with determining whether a power plant cooling system is heating...
Questions in other subjects:
Mathematics, 28.08.2019 18:00


Biology, 28.08.2019 18:00

Chemistry, 28.08.2019 18:00

Social Studies, 28.08.2019 18:00


