

Mathematics, 16.10.2020 07:01, avision42
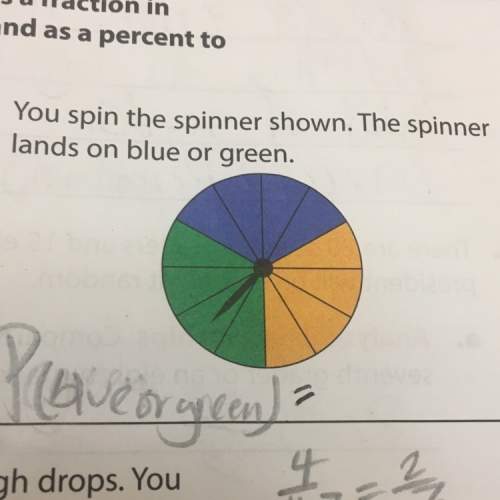
This data represents the number of different colored skittles in a bag. Using this select
the answer below that best describes the graph.
O The graph is left skewed with outliers.
O The distribution is symmetrical.
O The distribution is left skewed with no outliers.
O The distribution is right-skewed with no outliers.


Answers: 2


Other questions on the subject: Mathematics
Mathematics, 21.06.2019 14:00, Gheaton1889
Find the length of cu, the triangles are similar.
Answers: 2
Mathematics, 21.06.2019 19:30, iicekingmann
Is the power produced directly proportional to the wind speed, give reasons for your answer?
Answers: 1
Mathematics, 21.06.2019 23:30, byron17
Select the correct answer from each drop-down menu. james needs to clock a minimum of 9 hours per day at work. the data set records his daily work hours, which vary between 9 hours and 12 hours, for a certain number of days. {9, 9.5, 10, 10.5, 10.5, 11, 11, 11.5, 11.5, 11.5, 12, 12}. the median number of hours james worked is . the skew of the distribution is
Answers: 3
Do you know the correct answer?
This data represents the number of different colored skittles in a bag. Using this select
the answe...
Questions in other subjects:

Biology, 05.07.2019 14:30

Health, 05.07.2019 14:30


Biology, 05.07.2019 14:30
Mathematics, 05.07.2019 14:30


