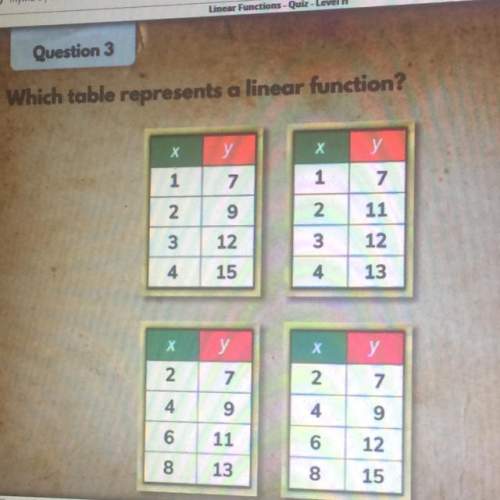
Mathematics, 15.10.2020 06:01, periwinkleaqua72
Economic models give you a framework for thinking so you can logically and systematically analyse changes in different aspects of the economy. Typically building an economic model starts with simplifying assumptions:
Assumptions for the Production Possibility Curve (PPC):
i) The economy can only produce 2 goods: Whch 2 goods is often decided by what you want to illustrate or analyse so for example for an economy it could be capital goods and consumer goods (quick bit of thinking - what do these terms mean?)
ii) It is a closed economy (no international trade)
iii) Factors of production are not perfectly interchangeable (some are better at producing Consumer Goods and some are better at Capital Goods)
Diagram:
More often than not for economics at the level of IB models are centred around a diagram and showing you know how the diagram is constructed is a key skill.
Take a piece of paper (Exercise book or A4)
Draw 2 axes (not too small so it is clear) and label them Consumer Goods (X-axis) and capital Goods (Y-axis)
Reason like this:
If the economy were to devote all its resources to producing Consumer Goods there would be a maximum it could produce. Plot this point somewhere along the Consumer Goods axis.
Alternatively if the economy were to devote all its resources to producing Capital Goods there would be a maximum it could produce. Plot this point somewhere along the Capital Goods axis.
Now plot all the points that show all the combinations of Consumer Goods and Capital Goods the economy could produce (take note of assumption iii above and this will determine the shape of the PPC.
Can you work out how the PPC will be drawn? Draw the curve.
Plot a point inside the PPC. What can you deduce if production is at this point?
Plot a point beyond the PPC and what can you categorically (without contradiction) say about this point?

Answers: 3
Other questions on the subject: Mathematics

Mathematics, 21.06.2019 14:00, debordc17
You are assembling pieces of an iron gate to complete a fence. the finished gate will look like the one below. in order to assemble the gate it is important to under how the pieces are related. part 1: how are pies 1 and 2 in the archway related? part 2: how are the rectangular sections 5 and 6 in the center of the gate related to each other?
Answers: 1

Mathematics, 21.06.2019 18:00, joseroblesrivera123
Since opening night, attendance at play a has increased steadily, while attendance at play b first rose and then fell. equations modeling the daily attendance y at each play are shown below, where x is the number of days since opening night. on what day(s) was the attendance the same at both plays? what was the attendance? play a: y = 8x + 191 play b: y = -x^2 + 26x + 126
Answers: 1

Mathematics, 21.06.2019 23:30, odellbeckham7171
When a valve is open 281 gallons of water go through it in one hour the number of gallons that would go through in 94 hours is
Answers: 1

Mathematics, 22.06.2019 00:10, sherlock19
Me its important ! marge runs an ice cream parlor. her speciality is triple chocolate sundaes. she can prepare 1 sundae every 2 minutes, and she earns $1.20 for each sundae she makes . if she just makes sundaes for a single shift of at most 4 hours and at least 2 hours , which function relates her earnings to the number of minutes she works?
Answers: 2
Do you know the correct answer?
Economic models give you a framework for thinking so you can logically and systematically analyse ch...
Questions in other subjects:

Mathematics, 12.10.2020 18:01

Mathematics, 12.10.2020 18:01

Social Studies, 12.10.2020 18:01

English, 12.10.2020 18:01


History, 12.10.2020 18:01


