

Mathematics, 15.10.2020 02:01, nataliaalejandradasi
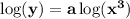
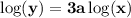
Data were collected on two variables, x and y, to create a model to predict y from x. A scatterplot of the collected data revealed a curved pattern with a possible cubic relationship (y=ax^3, where a is a constant) between the variables. Which of the following transformations would be most appropriate for creating linearity between the variables?
A - Taking the cube of y
B - Taking the cube root of y
C - Taking the cube root of both y and x
D - Taking the log of y
E - Taking the log of both y and x

Answers: 3


Other questions on the subject: Mathematics
Mathematics, 21.06.2019 19:00, eparikh7317
Rob spent 25%, percent more time on his research project than he had planned. he spent an extra h hours on the project. which of the following expressions could represent the number of hours rob actually spent on the project? two answers
Answers: 1
Mathematics, 22.06.2019 00:00, bracefacer42
The data set represents the ages of players in a chess club. 27, 34, 38, 16, 22, 45, 54, 60. what is the mean absolute deviation of the data set?
Answers: 3
Mathematics, 22.06.2019 00:20, jayleneeeee
The police chief wants to know if the city’s african americans feel that the police are doing a good job. identify the management problem (i. e dependent variable) and identify the independent variable.
Answers: 1
Do you know the correct answer?
Data were collected on two variables, x and y, to create a model to predict y from x. A scatterplot...
Questions in other subjects:


