

Mathematics, 14.10.2020 21:01, nicoleamor
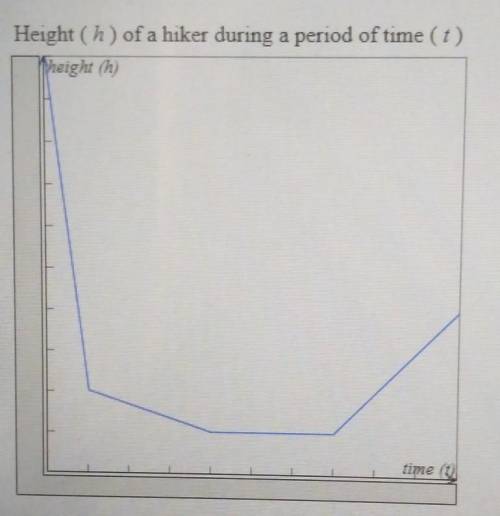
The graph shown represents the height (h) of a hiker during a period of time (t). Use the vertical line test to determine if the relation represented on the graph is a function. Complete the explanation. since___vertical line will pass through more than one point, the graph_the vertical lines test so the relation_ a function

Answers: 2


Other questions on the subject: Mathematics
Mathematics, 22.06.2019 01:00, saigeshort
Pentagon abcde is dilated according to the rule do,3(x, y) to create the image pentagon a'b'c'd'e', which is shown on the graph. what are the coordinates of point a of the pre-image? a) (-1, 1)b) (-1, 2)c) (-9, 6)d) (-9, 18)
Answers: 3
Do you know the correct answer?
The graph shown represents the height (h) of a hiker during a period of time (t). Use the vertical l...
Questions in other subjects:

Mathematics, 18.07.2020 04:01


History, 18.07.2020 04:01


