

Mathematics, 14.10.2020 20:01, tanviknawale
1
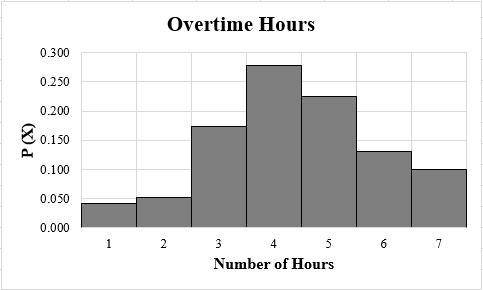
The data given below show the number of overtime hours worked in one week per employee. Use the data to complete parts (a) and (b).
Overtime hours
0
2 3 4 5 6
Employees
8 10 33 53 43 25 19
(a) Construct a probability distribution
(b) Graph the probability distribution using a histogram and describe its shape.
(a) Construct the probability distribution by completing the table below.
1
2
3
4
5
6
P(x)
1
(Round to three decimal places as needed.)

Answers: 3


Other questions on the subject: Mathematics
Mathematics, 21.06.2019 13:00, tae8002001
Three times the difference of federico’s age, and 4, increased by 7, is greater than 37. what are possible values of federico’s age?
Answers: 1
Mathematics, 21.06.2019 17:00, Calvinailove13
An air conditioning system can circulate 350 cubic feet of air per minute. how many cubic yards of air can it circulate per minute?
Answers: 3
Mathematics, 21.06.2019 20:30, girlygirl2007
Jason went to an arcade to play video games. he paid $2 for every 11 tokens he bought. he spent a total of $16 on tokens. which equation can be used to determine, t, the number lf tokens jason bought
Answers: 1
Mathematics, 21.06.2019 20:40, jaydenrobinettewca
Ineed someone to me answer my question i have to have this done and knocked out
Answers: 2
Do you know the correct answer?
1
The data given below show the number of overtime hours worked in one week per employee. Use the d...
Questions in other subjects:

Computers and Technology, 09.12.2021 14:40
Mathematics, 09.12.2021 14:40


Chemistry, 09.12.2021 14:40


