

Mathematics, 13.10.2020 09:01, pedropaulofpedrosapp
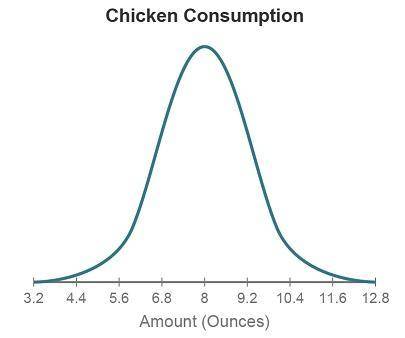
The graph shows the distribution of the amount of chicken (in ounces) that adults eat in one sitting. The distribution is approximately Normal, with a mean of 8 ounces and a standard deviation of 1.2 ounces.
What percentage of adults eat more than 10.4 ounces of chicken in one sitting?
2.5%
47.5%
95%
97.5%

Answers: 2


Other questions on the subject: Mathematics
Mathematics, 21.06.2019 23:00, look26goingjbgy
Complete the conditional statement. if a + 2 < b + 3, then a < b b < a a – b < 1 a < b + 1
Answers: 3
Mathematics, 21.06.2019 23:30, xxaurorabluexx
Pleting the square f the given find the x-intercepts of the parabola with vertex (-5,13) and y-intercept (0, 12). write your answer in this form: (14,.99). if necessary, round to the nearest hundredth. *- h enter the correct answer, de verter, and ametry 00000 done doo
Answers: 2
Mathematics, 22.06.2019 04:30, yourmumsanoodle
Imade a beaded necklace that was 2/6 blue, 3/5 green and the rest were white. did the necklace have more blue or green how many white beads did it have.
Answers: 1
Do you know the correct answer?
The graph shows the distribution of the amount of chicken (in ounces) that adults eat in one sitting...
Questions in other subjects:
Mathematics, 09.01.2021 03:30

Chemistry, 09.01.2021 03:30

Physics, 09.01.2021 03:30
Chemistry, 09.01.2021 03:30
Mathematics, 09.01.2021 03:30
Mathematics, 09.01.2021 03:30
Mathematics, 09.01.2021 03:30
Physics, 09.01.2021 03:30


