Mathematics, 13.10.2020 02:01, kactus
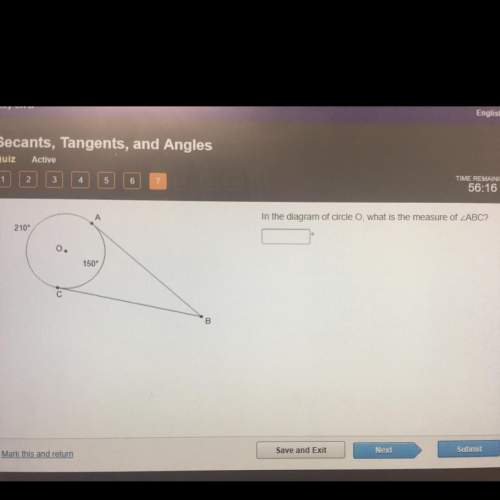
John has savings of $6. He plans to save $2 every week from his weekly allowance for the next 4 weeks. Does the graph show the relationship between number of weeks from now and the money saved by John per week? A. No, because the slope of the graph is 6 and the y-intercept is 2 B. No, because the y-intercept of the graph is 6 and the slope is 2 C. Yes, because the slope of the graph is 6 and the y-intercept is 2 D. Yes because the y-intercept of the graph is 6 and the slope is 2

Answers: 3
Other questions on the subject: Mathematics

Mathematics, 21.06.2019 16:20, maritzamartinnez
Two lines parallel to the same plane are parallel to eachother
Answers: 1


Mathematics, 21.06.2019 18:00, keasiabrown25
Determine the difference: 3.2 × 10¹⁰ – 1.1 × 10¹⁰. write your answer in scientific notation.
Answers: 1

Mathematics, 21.06.2019 20:20, krystenlitten
Pls brainliest will be awarded if answer is correct
Answers: 1
Do you know the correct answer?
John has savings of $6. He plans to save $2 every week from his weekly allowance for the next 4 week...
Questions in other subjects:


Geography, 18.03.2021 02:20


Mathematics, 18.03.2021 02:20


English, 18.03.2021 02:20


Mathematics, 18.03.2021 02:20

Mathematics, 18.03.2021 02:20


