

Mathematics, 12.10.2020 19:01, Kazya4
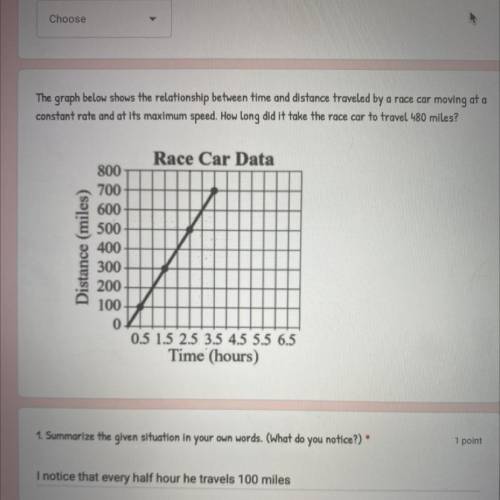
The graph below shows the relationship between time and distance traveled by a race car moving at a
constant rate and at its maximum speed. How long did it take the race car to travel 480 miles?
Race Car Data
Distance (miles)
800
700
600
500
400
300
200
100
0
0.5 1.5 2.5 3.5 4.5 5.5 6.5
Time (hours)

Answers: 1


Other questions on the subject: Mathematics
Mathematics, 21.06.2019 20:00, duhitzmay4693
The scatterplot below shows the number of hours that students read weekly and the number of hours that they spend on chores weekly. which statement about the scatterplot is true?
Answers: 2
Mathematics, 21.06.2019 21:30, erikacastro259
Select all the correct locations on the table. consider the following expression. 76.493 select "equivalent" or "not equivalent" to indicate whether the expression above is equivalent or not equivalent to the values or expressions in the last column equivalent not equivalent 343 equivalent not equivalent 49 78.498 78.498 75.493 equivalent not equivalent 75.7 equivalent not equivalent
Answers: 3
Mathematics, 21.06.2019 23:00, keishadawson
Could someone me with this question i’ve been stuck on it for 20 minutes
Answers: 1
Mathematics, 21.06.2019 23:10, izzynikkie
Which graph represents the linear function below? y-4= (4/3)(x-2)
Answers: 2
Do you know the correct answer?
The graph below shows the relationship between time and distance traveled by a race car moving at a...
Questions in other subjects:

Mathematics, 19.04.2021 20:50
Mathematics, 19.04.2021 20:50

Biology, 19.04.2021 20:50

History, 19.04.2021 20:50

Computers and Technology, 19.04.2021 20:50

Mathematics, 19.04.2021 20:50


