

Mathematics, 12.10.2020 14:01, rscott400
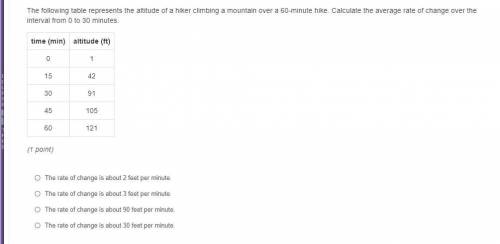
1.The following table represents the altitude of a hiker climbing a mountain over a 60-minute hike. Calculate the average rate of change over the interval from 0 to 30 minutes.
A. The rate of change is about 2 feet per minute.
B. The rate of change is about 3 feet per minute.
C. The rate of change is about 90 feet per minute.
D. The rate of change is about 30 feet per minute.
2.A truck is leaving a post office and heading out to deliver mail. The table shows the truck's distance d from the post office at time t. Calculate the average rate of change over the interval from 8 to 15 minutes.
A. The rate of change is about 0.8 kilometers per minute.
B. The rate of change is 3.5 kilometers per minute.
C. The rate of change is 7 kilometers per minute.
D. The rate of change is 1 kilometer per minute.
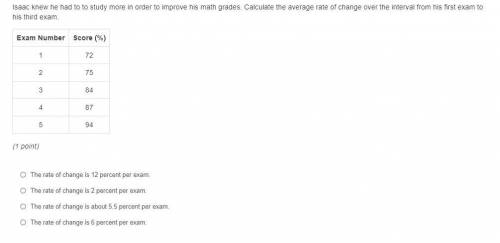
3.Isaac knew he had to to study more in order to improve his math grades. Calculate the average rate of change over the interval from his first exam to his third exam.
A. The rate of change is 12 percent per exam.
B. The rate of change is 2 percent per exam.
C. The rate of change is about 5.5 percent per exam.
D. The rate of change is 6 percent per exam.
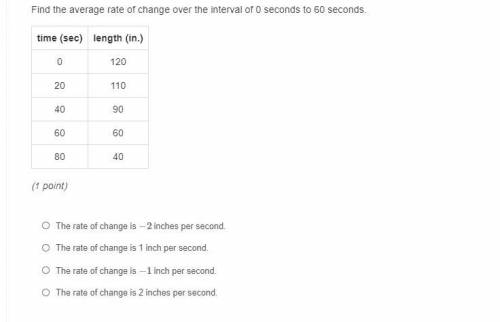
4.Find the average rate of change over the interval of 0 seconds to 60 seconds.
A. The rate of change is −2 inches per second.
B. The rate of change is 1 inch per second.
C. The rate of change is −1 inch per second.
D. The rate of change is 2 inches per second.
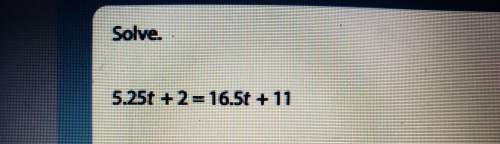
5.Find the average rate of change over the interval of 2 minutes to 11 minutes.
A. The rate of change is 19 of a kilometer per minute.
B. The rate of change is 9 kilometers per minute.
C. The rate of change is 13 of a kilometer per minute.
D. The rate of change is 3 kilometers per minute.
If you answer please answer with all of the with all of the questions listed thank you.


Answers: 2


Other questions on the subject: Mathematics
Mathematics, 21.06.2019 21:30, shymitch32
Create a graph for the demand for starfish using the following data table: quantity/price of starfish quantity (x axis) of starfish in dozens price (y axis) of starfish per dozen 0 8 2 6 3 5 5 2 7 1 9 0 is the relationship between the price of starfish and the quantity demanded inverse or direct? why? how many dozens of starfish are demanded at a price of five? calculate the slope of the line between the prices of 6 (quantity of 2) and 1 (quantity of 7) per dozen. describe the line when there is a direct relationship between price and quantity.
Answers: 3
Mathematics, 22.06.2019 00:00, Lions8457
City l has a temperature of −3 °f. city m has a temperature of −7 °f. use the number line shown to answer the questions: number line from negative 8 to positive 8 in increments of 1 is shown. part a: write an inequality to compare the temperatures of the two cities. (3 points) part b: explain what the inequality means in relation to the positions of these numbers on the number line. (4 points) part c: use the number line to explain which city is warmer. (3 points)
Answers: 2
Do you know the correct answer?
1.The following table represents the altitude of a hiker climbing a mountain over a 60-minute hike....
Questions in other subjects:


History, 03.04.2020 02:09

Mathematics, 03.04.2020 02:09
Mathematics, 03.04.2020 02:09


