

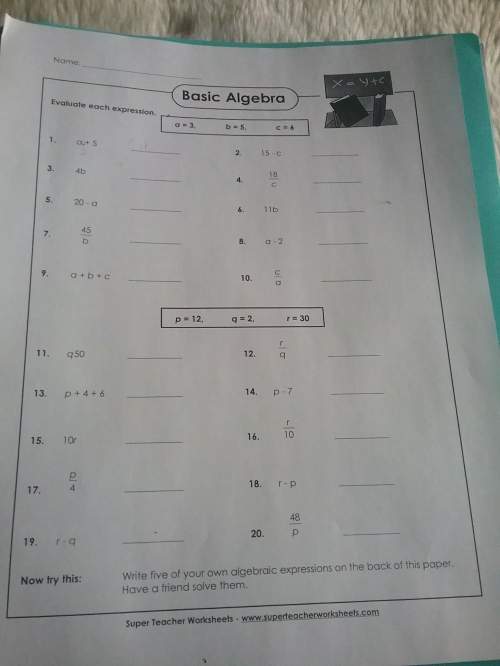
Mathematics, 12.10.2020 08:01, lataviabaker4608
Here are points A and B. Plot the points for each dilation described.
C is the image of B using A as the center of dilation and a scale factor of 2.
D is the image of A using B as the center of dilation and a scale factor of 2.
E is the image of B using A as the center of dilation and a scale factor of 1/2.
F is the image of A using B as the center of dilation and a scale factor of 1/2.
Did you find and label points C, D, E, F?
Going from left to right, what is the order of the points you labeled?

Answers: 3


Other questions on the subject: Mathematics
Mathematics, 21.06.2019 21:10, maylasia
Given: lines a and b are parallel and line c is a transversal. prove: 2 is supplementary to 8 what is the missing reason in the proof? statement reason 1. a || b, is a transv 1. given 2. ∠6 ≅ ∠2 2. ? 3. m∠6 = m∠2 3. def. of congruent 4. ∠6 is supp. to ∠8 4. def. of linear pair 5. ∠2 is supp. to ∠8 5. congruent supplements theorem corresponding angles theorem alternate interior angles theorem vertical angles theorem alternate exterior angles theorem
Answers: 3
Mathematics, 22.06.2019 03:10, magicallyhello
Factor 15x^3 - 5x^2 +6x-2 by grouping. what is the resulting expression
Answers: 3
Mathematics, 22.06.2019 04:10, kernlife
You are in charge of the customer service phone line with many employees. at the end of each phone callthe customers are asked to rate their service from 1 to 5 stars, with 5 being the best. you find the averagerating for 20 randomly selected employees and decide you want to improve the ratings so you require thoseemployees to go through a new training program. you then wait a week and find the new average rating foreach employee. the average change is an increase in 1.3 stars with a standard devation of .9 stars.(a) is this data paired or not paired? (b) what are the null and alternative hypothesis being tested? (c) what is the t-statistic you would use? write the general formula and the final calculation.(d) sketch a t-distribution, label your t-statistic and the probability you would be interested in:
Answers: 2
Do you know the correct answer?
Here are points A and B. Plot the points for each dilation described.
C is the image of B using A a...
Questions in other subjects:

Social Studies, 18.12.2020 23:40

Mathematics, 18.12.2020 23:40
Mathematics, 18.12.2020 23:40


Spanish, 18.12.2020 23:40
Chemistry, 18.12.2020 23:40


