

Mathematics, 11.10.2020 23:01, faithiemusic8821
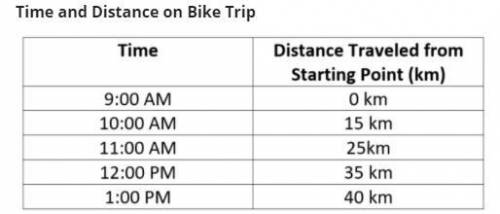
Max and a friend took part in a cross-country bike trip. The trip started at 9:00 a. m. The table shows how far they traveled from the starting point each hour until they reached their destination at 1:00 p. m.
Choose the best type of graph to represent the data in the chart below.
Then, make the graph.


Answers: 3
 Distance travelled from starting point
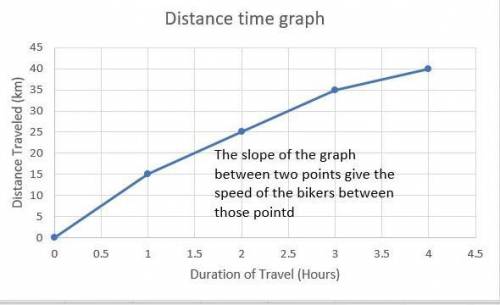


Other questions on the subject: Mathematics
Mathematics, 21.06.2019 12:30, edna27
(note i put the graph in so plz )the graph shows the amount of water that remains in a barrel after it begins to leak. the variable x represents the number of days that have passed since the barrel was filled, and y represents the number of gallons of water that remain in the barrel. what is the slope of the line
Answers: 1
Mathematics, 21.06.2019 15:00, jfarley259
Hye ryung is the president of the local chapter of the american medical students association (amsa). she is organizing local outreach and informational meetings. at her first meeting there are five people present (including herself). every month after that her group grows by 5 people. a. how many members are in the group after 6 months? b. the logistics of hosting and feeding her group at meetings was more complicated than expected. the cost of feeding 5 people at her first meeting was $30, for 10 people it was $35, for 15 it was $45, and after 6 months all of the costs had added up to $100. write a function to model the cost with the number of people attending meetings. c. what connections can you make between the linear growth of the group’s membership and the increasing costs of running meetings?
Answers: 3
Mathematics, 21.06.2019 21:00, jonquil201
These box plots show the number of electoral votes one by democratic and republican presidential candidates for the elections from 1984 through 2012. which statement best compares the spread of the data sets
Answers: 2
Mathematics, 21.06.2019 23:00, jjackson0010
If mary had 320 toy cars and she gave her friend 50 cars and then she gave her brother 72 more cars how much toy cars would mary have left ● explain with proper details
Answers: 1
Do you know the correct answer?
Max and a friend took part in a cross-country bike trip. The trip started at 9:00 a. m. The table sh...
Questions in other subjects:
Mathematics, 29.08.2021 01:00

History, 29.08.2021 01:00

Biology, 29.08.2021 01:00

Mathematics, 29.08.2021 01:00

Social Studies, 29.08.2021 01:00

Geography, 29.08.2021 01:00


