

Mathematics, 09.10.2020 20:01, milkshakegrande101
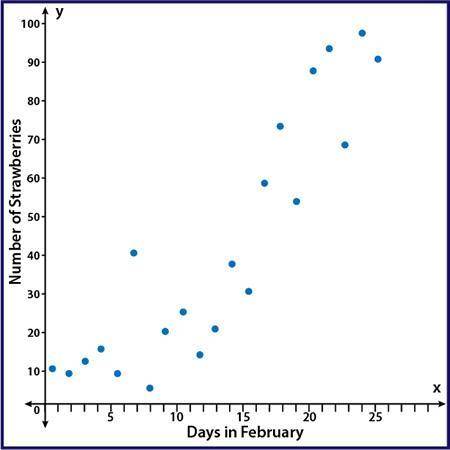
The scatter plot shows the number of strawberries that have been picked on the farm during the month of February:
A scatter plot with points showing an upward trend with points that are moderately spread out from a line of best fit. The y axis is labeled Number of Strawberries and the x axis is labeled Days in February
Part A: Using computer software, a correlation coefficient of r = 0.01 was calculated. Based on the scatter plot, is that an accurate value for this data? Why or why not? (5 points)
Part B: Instead of comparing the number of strawberries picked and the day in February, write a scenario that would be a causal relationship for strawberries picked on the farm. (5 points)

Answers: 1


Other questions on the subject: Mathematics
Mathematics, 21.06.2019 16:30, Zayo1337
An airport in death valley is 60 feet below sea level, and an airplane is flying 2,000 feet above sea level. how many feet must the plane descend in order to land? a. 2060 b. 2000 feet c. 1940 feet d. 1880 feet e.1400 feet will mark as brainliest
Answers: 2
Mathematics, 21.06.2019 19:30, amatulli
Abird on top of a 200 ft bridge tower sees a man standing on the lower part of the bridge (which is 50 ft above the ground). the angle of depression from the bird is 26 ̊. how far is the man from the base of the bridge tower? with explanation and pictures .
Answers: 1
Do you know the correct answer?
The scatter plot shows the number of strawberries that have been picked on the farm during the month...
Questions in other subjects:

History, 18.03.2020 20:54


French, 18.03.2020 20:54


