Mathematics, 08.10.2020 08:01, Gclaytor7880
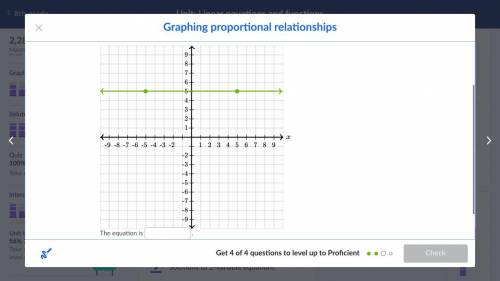
Graph the line that represents a proportional relationship between y and x where the unit rate of change of y with respect to x is 0.4 In other words, a change of 1 unit in x corresponds to a change of 0.4 units in y. Graph the line and write the equation of the line.


Answers: 3
Other questions on the subject: Mathematics

Mathematics, 20.06.2019 18:02, mannablofey23
What is the midpoint of the segment below? (-4,-7) (5,6)
Answers: 1

Mathematics, 21.06.2019 17:30, nallaico585
What is the greater volume 72 quarts or 23 gallons
Answers: 1

Mathematics, 21.06.2019 22:00, sebcbal
The mean finish time was 185.52 with a standard deviation of 0.327 minute. the winning car driven by chris finished in 185.13. the previous year race had a mean finish time of 110.3 with a standard deviation of 0.106. the winning car that year driven by karen finished in 110.13 minutes. find their respective z-scores. chris - z-score karen “- z-score
Answers: 1
Do you know the correct answer?
Graph the line that represents a proportional relationship between y and x where the unit rate of ch...
Questions in other subjects:


Mathematics, 25.06.2021 02:50


Mathematics, 25.06.2021 02:50

Mathematics, 25.06.2021 02:50


