

Mathematics, 07.10.2020 23:01, yoyo0123
2. Suppose a new standardized test is given to 100 randomly selected third-grade students in New Jersey. The sample average score Y on the test is 58 points and the sample standard deviation sY is 8 points. a. The authors plan to administer the test to all third-grade students in New Jersey. Construct a 95% con dence interval for the mean score of all New Jersey third graders. b. Suppose the same test is given to 200 randomly selected third graders from Iowa, producing a sample average of 62 points and sample standard deviation of 11 points. Construct a 90% con dence interval for the di erence in mean scores between Iowa and New Jersey. c. Can you conclude with a high degree of con dence that the population means for Iowa and New Jersey students are di erent

Answers: 2
 ~
~ 
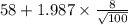
 = sample average score = 58 points
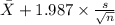
 = population mean score of all New Jersey third graders
 < 1.987) = 0.95 {As the critical value of t at 99 degrees of
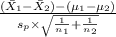
 <
<  <
<  ) = 0.95
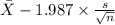 <
<  ) = 0.95
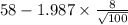 ,
,  ]
]
 ~
~ 
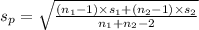
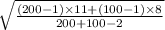 = 3.163
 ) is;
) is;
 < 1.645) = 0.90 {As the critical value of t at 298 degrees of
 ,
, 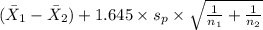 ]
]
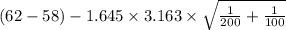 ,
, 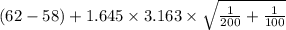 ]
]


Other questions on the subject: Mathematics
Do you know the correct answer?
2. Suppose a new standardized test is given to 100 randomly selected third-grade students in New Jer...
Questions in other subjects:
Mathematics, 05.09.2020 09:01


Mathematics, 05.09.2020 09:01

Biology, 05.09.2020 09:01


