


PLEASE HELP
Which graph represents the solution set for the compound inequality below?
- 1/3x...

Mathematics, 06.10.2020 22:01, g0606997
PLEASE HELP
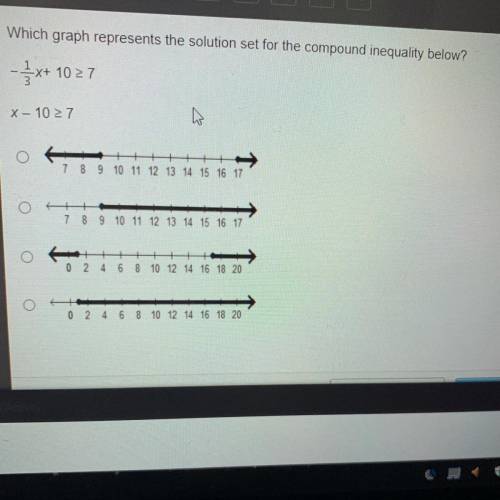
Which graph represents the solution set for the compound inequality below?
- 1/3x+ 10 _> 27
X – 10 >7

Answers: 1
Other questions on the subject: Mathematics
Mathematics, 21.06.2019 20:00, PastryCrisp
The function f(x) = 14,600(1.1)* represents the population of a town x years after it was established. what was the original population of the town?
Answers: 1
Mathematics, 21.06.2019 22:30, raquelqueengucci25
What is the distance from zero if a quadratic function has a line of symmetry at x=-3 and a zero at 4
Answers: 1
Mathematics, 22.06.2019 03:00, jasmindelvalle78
The curved part of the figure is the semicircle what is the best approximation for the area of this figure
Answers: 3
Do you know the correct answer?
Questions in other subjects:


