

Mathematics, 05.10.2020 03:01, robertstoll81
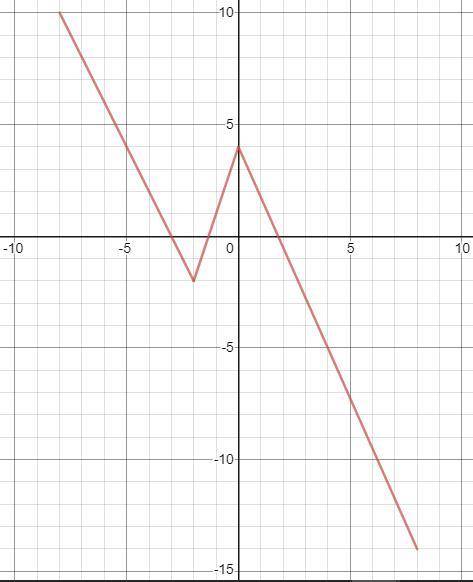
The graph of f(x) is shown below.
For each point (a, b) on the graph of y = f(x), the point ( 3a - 1, b/2) is plotted to form the graph of another function y = g(x). For example, (0,2) lies on the graph of y = f(x), so (3 x 0 - 1, 2/2) = (-1,1) lies on the graph of y = g(x).
(a) Plot the graph of y = g(x). Include the diagram in your solution.
(b) Express g(x) in terms of f(x).
(c) Describe the transformations that you would apply to the graph of y = f(x) to obtain the graph of y = g(x). For example, one transformation might be to stretch the graph horizontally by a factor of 5.

Answers: 1


Other questions on the subject: Mathematics
Mathematics, 21.06.2019 15:10, fastpitchhailey1354
Marcus needs to rewrite f(x) = x2 + 6x + 4 in vertex form.
Answers: 1
Mathematics, 21.06.2019 19:00, SakChan8367
Ab based on the given diagram, if m_1 = 60° then m 2 = 30 60 90 180
Answers: 1
Mathematics, 21.06.2019 20:00, Chen5968
The distribution of the amount of money spent by students for textbooks in a semester is approximately normal in shape with a mean of $235 and a standard deviation of $20. according to the standard deviation rule, how much did almost all (99.7%) of the students spend on textbooks in a semester?
Answers: 2
Do you know the correct answer?
The graph of f(x) is shown below.
For each point (a, b) on the graph of y = f(x), the point ( 3a -...
Questions in other subjects:

English, 17.11.2020 01:00

Mathematics, 17.11.2020 01:00


Biology, 17.11.2020 01:00
Chemistry, 17.11.2020 01:00
History, 17.11.2020 01:00
Biology, 17.11.2020 01:00
History, 17.11.2020 01:00


