

Mathematics, 04.10.2020 05:01, winterblanco
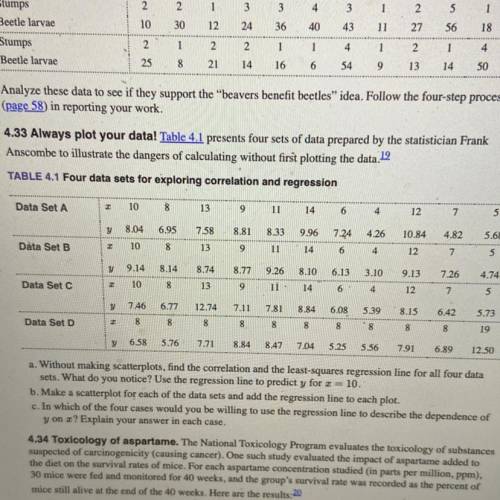
4.33 Always plot your data! Table 4.1 presents four sets of data prepared by the statistician Frank
Anscombe to illustrate the dangers of calculating without first plotting the data.12
TABLE 4.1 Four data sets for exploring correlation and regression
Data Set A
10
8
13
9
11
14
6
12
5
y 8.04
6.95
4.82
5.68
7.58
13
8.818.33 9.96 7.24 4.26
11 14 6
10.84
12
10
8
9
Data Set B
y
9.14
8.14
8.77
8.10
6.13
3.10
9.13
7.26
4.74
8.74
13
9.26
11
2
Data Set C
10
00
8
9
14
6
4
12
5
y 7.46
6.77
7.81
8.84
5.39
8.15
6.42
12.74
8
7.11
8
6.08
8
5.73
19
8
8
8
8
Data Set D
8
8
8
y 6.58 5.76 7.71
8.848.47 7.04 5.25 5.56
791
6.89
12.50
a. Without making scatterplots, find the correlation and the least-squares regression line for all four data
sets. What do you notice? Use the regression line to predict y for x = 10.
b. Make a scatterplot for each of the data sets and add the regression line to each plot.
c. In which of the four cases would you be willing to use the regression line to describe the dependence of
y on ar? Explain your answer in each case.

Answers: 3


Other questions on the subject: Mathematics
Mathematics, 21.06.2019 14:30, kawaiiiiiiii4715
The circumference of a circle is 5 pi cm. what is the area of the circle?
Answers: 2
Mathematics, 21.06.2019 16:10, zayzay162
A) if $50000 is invested in a bank account that pays 9.3% of interest compounded on a six-monthly basis, how much money will be in the account after 3 and 12 years? b) if matusalen's father had put $2.0 in the bank when he was born and there, how long would matusalen have had to his death (969 years later) if the interest was 7% per year composed each month and weekly?
Answers: 1
Mathematics, 21.06.2019 18:30, bdjxoanbcisnkz
Acone with volume 1350 m³ is dilated by a scale factor of 1/3. what is the volume of the resulting cone? enter your answer in the box. m³
Answers: 1
Do you know the correct answer?
4.33 Always plot your data! Table 4.1 presents four sets of data prepared by the statistician Frank...
Questions in other subjects:

English, 14.11.2020 02:00
Mathematics, 14.11.2020 02:00
Mathematics, 14.11.2020 02:00
Mathematics, 14.11.2020 02:00
English, 14.11.2020 02:00
Mathematics, 14.11.2020 02:00

Social Studies, 14.11.2020 02:00
English, 14.11.2020 02:00


