

Mathematics, 29.09.2020 05:01, 20jacksone
Help, please! :(
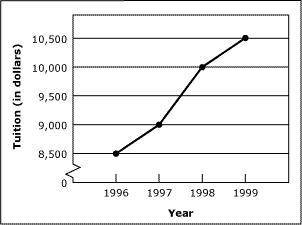
The line graph shows tuition amounts for a university for the years 1996 through 1999. Which of the following is a valid claim based on the graph?
(A): The greatest one-year increase in tuition occurred from 1997 to 1998.
(B): The rate of increase was the same from year to year.
(C): Tuition rates doubled between 1996 and 1999.
(D): Tuition rates will continue to increase over the next 5 years.

Answers: 3


Other questions on the subject: Mathematics
Mathematics, 21.06.2019 18:00, phamleson8697
Use the distributive law to multiply. 3(4x + 5y + 6)
Answers: 2
Mathematics, 21.06.2019 20:00, arianaaldaz062002
If the simple annual interest rate on a loan is 6, what is the interest rate in percentage per month?
Answers: 1
Mathematics, 21.06.2019 23:00, cifjdhhfdu
If a company produces x units of an item at a cost of $35 apiece the function c=35x is a of the total production costs
Answers: 2
Do you know the correct answer?
Help, please! :(
The line graph shows tuition amounts for a university for the years 1996 through 1...
Questions in other subjects:


Chemistry, 27.06.2020 23:01

Computers and Technology, 27.06.2020 23:01


