Strawberries Picked
100
90
80
70
60
Quarts Picked
40
30
20
10
1
8 9 10
Time hours)
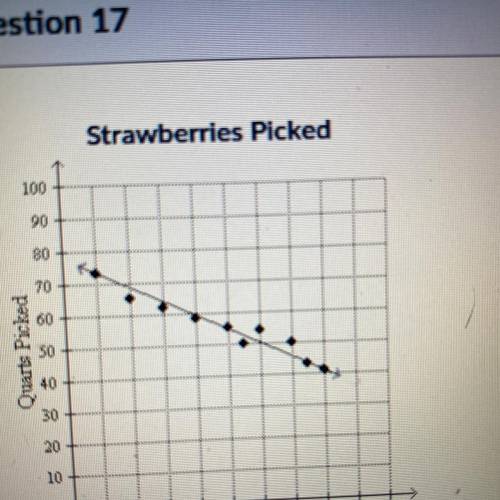
Use the scatter plot that shows the number of quarts of strawberries picked each hour. Use
the points (1, 73) and (8,41) to write the slope-intercept form of an equation for the line of
fit shown in the scatter plot.
Agroup of randomly selected members of the foodies food club were asked to pick their favorite type of food. the bar graph below shows the results of the survey. there are 244 members in the foodies.