

Mathematics, 27.09.2020 04:01, sleepyflower10
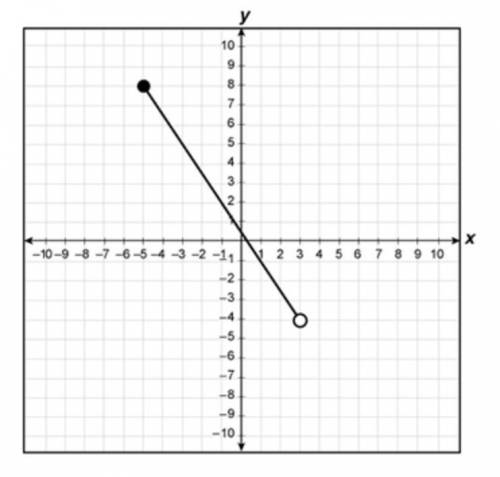
The graph of part of linear function h is shown on the grid.
Which inequality best represents the domain of the part shown?
−5≤x<3
−5
−4
−4≤h(x)<8

Answers: 2


Other questions on the subject: Mathematics
Mathematics, 21.06.2019 15:00, cartizeb23
Simplify (a/b - b/a) times (a - a^2/a+b) a - a^2/a=b is a mixed number
Answers: 2
Mathematics, 21.06.2019 18:00, glocurlsprinces
The longer leg of a 30° 60° 90° triangle is 16 times square root of three how long is a shorter leg
Answers: 1
Mathematics, 21.06.2019 19:50, jlankford148
A3-dimensional figure has a square base and 4 lateral faces that meet at a point. explain the difference between the cross sections when a slice is made perpendicular to the base through the vertex, and when a slice is made perpendicular to the base and not through the vertex
Answers: 2
Mathematics, 21.06.2019 21:00, CoolDudeTrist
Construct the graph that models the given situation
Answers: 1
Do you know the correct answer?
The graph of part of linear function h is shown on the grid.
Which inequality best represents the d...
Questions in other subjects:


History, 05.09.2020 19:01


Biology, 05.09.2020 19:01


