

Mathematics, 25.09.2020 08:01, agyinbriana
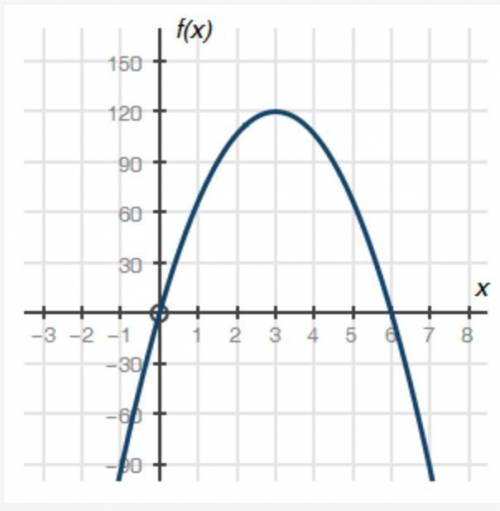
The graph below shows a company's profit f(x), in dollars, depending on the price of pens x, in dollars, sold by the company:
Part A: What do the x-intercepts and maximum value of the graph represent? What are the intervals where the function is increasing and decreasing, and what do they represent about the sale and profit? (4 points)
Part B: What is an approximate average rate of change of the graph from x = 3 to x = 5, and what does this rate represent? (3 points)
Part C: Describe the constraints of the domain. (3 points)

Answers: 1


Other questions on the subject: Mathematics
Mathematics, 21.06.2019 17:40, PONBallfordM89
How can the correlation in the scatter plot graph below best be described? positive correlation negative correlation both positive and negative no correlation
Answers: 1
Mathematics, 21.06.2019 22:30, ashleywoo21361
Assume that y varies inversely with x. if y=1.6 when x=0.5 find x when y=3.2
Answers: 1
Do you know the correct answer?
The graph below shows a company's profit f(x), in dollars, depending on the price of pens x, in doll...
Questions in other subjects:

Mathematics, 03.02.2021 17:50

Spanish, 03.02.2021 17:50


Biology, 03.02.2021 17:50
Mathematics, 03.02.2021 17:50
Biology, 03.02.2021 17:50


