

Mathematics, 25.09.2020 03:01, orozcoalbeert
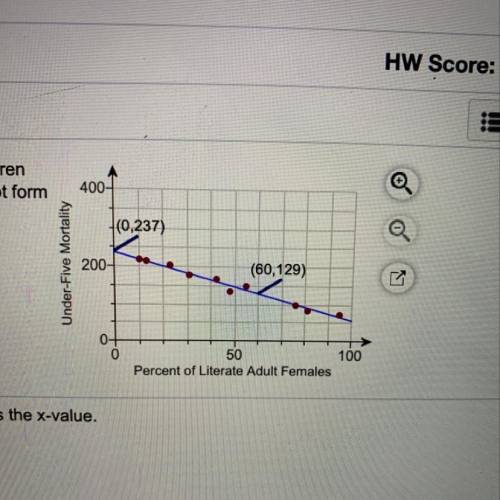
Shown to the right is a scatter plot that indicates a relationship between the percentage of adult females in a country who are literate and the mortality of children
under five (per thousand). Also shown is a line that passes through or near the points. Find a linear function that models the data by finding the slope-intercept form
of the line's equation. Use the function to make a prediction about child mortality based on the percentage of adult females in a country who are literate.

Answers: 2


Other questions on the subject: Mathematics
Mathematics, 21.06.2019 20:20, shartman22
20 solve 2(4 x + 3) < 5 x + 21. a) { x | x < 9} b) { x | x > -5} c) { x | x > -9} d) { x | x < 5}
Answers: 2
Do you know the correct answer?
Shown to the right is a scatter plot that indicates a relationship between the percentage of adult f...
Questions in other subjects:


Biology, 06.09.2019 20:30
Mathematics, 06.09.2019 20:30


