


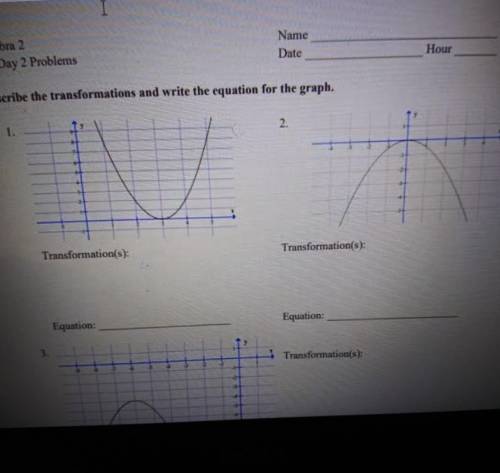
Describe the Transformations and write the equation for the graph
...

Mathematics, 25.09.2020 03:01, oranzajimenez
Describe the Transformations and write the equation for the graph

Answers: 3
Other questions on the subject: Mathematics
Mathematics, 21.06.2019 20:00, PastryCrisp
The function f(x) = 14,600(1.1)* represents the population of a town x years after it was established. what was the original population of the town?
Answers: 1
Mathematics, 21.06.2019 23:30, tyresharichardson29
Ahighway between points a and b has been closed for repairs. an alternative route between there two locations is to travel between a and c and then from c to b what is the value of y and what is the total distance from a to c to b?
Answers: 1
Mathematics, 22.06.2019 00:00, djjdjdjdjdNfnd1941
Consider the following geometry problems in 3-space enter t or f depending on whether the statement is true or false. (you must enter t or f -- true and false will not work.) f equation editorequation editor 1. a plane and a line either intersect or are parallel t equation editorequation editor 2. two planes parallel to a third plane are parallel f equation editorequation editor 3. two lines either intersect or are parallel f equation editorequation editor 4. two planes orthogonal to a third plane are parallel f equation editorequation editor 5. two planes orthogonal to a line are parallel f equation editorequation editor 6. two planes either intersect or are parallel f equation editorequation editor 7. two lines orthogonal to a third line are parallel t equation editorequation editor 8. two lines parallel to a third line are parallel t equation editorequation editor 9. two planes parallel to a line are parallel f equation editorequation editor 10. two lines parallel to a plane are parallel f equation editorequation editor 11. two lines orthogonal to a plane are parallel
Answers: 2
Mathematics, 22.06.2019 03:20, isalybeaudion2205
Arepresentative from plan 1 wants to use the graph below to sell health plans for his company. how might the graph be redrawn to emphasize the difference between the cost per doctor visit for each of the three plans? the scale on the y-axis could be changed to 0–100. the scale on the y-axis could be changed to 25–40. the interval of the y-axis could be changed to count by 5s. the interval of the y-axis could be changed to count by 20s.
Answers: 2
Do you know the correct answer?
Questions in other subjects:


English, 29.07.2019 18:30


Geography, 29.07.2019 18:30


