

Mathematics, 20.09.2020 15:01, 10040813
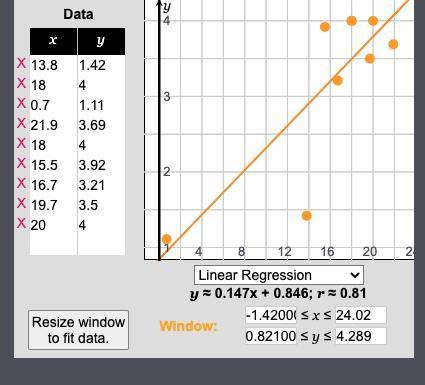
Step 1: Collect and organize your data. Using the Super Survey Simulator, survey 10 students of your choice and gather data. Create an organized representation of your data below. What do you think the purpose of this survey is? Explain. The main purpose of the survey is to see how the amount of studying you do relates to your overall GPA Step 2: Graph your data. After organizing your data, you will now create a graphical representation of your data. Why is a scatterplot an appropriate display for this data set? A scatter plot can also be useful for identifying other patterns in data. We can divide data points into groups based on how closely sets of points cluster together. Scatter plots can also show if there are any unexpected gaps in the data and if there are any outlier points What features would need to be included on a scatterplot so that the data can be easily analyzed? Make a list of needed features and explain why each is important to the graph. The more plot point the better but you must have at least three points, a labeled X-axis and Y-axis, and a table for the data to be organized into. Next, you will make a scatterplot. Name a point that will be on your scatterplot and describe what it represents. DATA USED: CAFE, CLASS ROOM Using the regression calculator in your tool bar, create a scatterplot using your data set from step 1. Insert a screenshot of your scatterplot, or recreate it below. HOURS: X GPA: Y Now that you have represented your data graphically, it can be more easily analyzed. Describe how the line of best fit and the correlation coefficient can be used to determine the correlation between the two variables on your graph. 1. Describe the type of correlation between the two variables on your graph. How do you know? 2.Does the correlation between the variables imply causation? Explain. 3.How do you calculate the residuals for a scatterplot? 4.Calculate the residuals for your scatterplot in step 2d.

Answers: 1


Other questions on the subject: Mathematics
Mathematics, 21.06.2019 16:20, angelb2472
Consider the function y = f(x)=3^x the values of f(1/2) and f(1/4). rounded to the nearest hundredth, are__and__ respectively
Answers: 3
Mathematics, 21.06.2019 17:30, SethSimunek
Choose the number sentence that shows the identity property of addition. a. 122 = 61 + 61 b. 62 = 1 + 61 c. 61 = 0 + 61
Answers: 1
Mathematics, 21.06.2019 18:30, angelapegues20097
Tyler enjoys the fish so much that after his birthday his family decides to take him to a famous aquarium a tank at the aquarium is similar to his tank with the scale factor of 8 how many times greater is the volume of the tank at the aquarium than the volume of tyler tank
Answers: 2
Mathematics, 21.06.2019 19:00, abraham1366
Which values of p and q result in an equation with exactly one solution? px-43=-42x+q choose all answers that apply: a) p=-43 and q=-43 b) p=42 and q=43 c) p=43 and q=−42 d) p=42 and q=42
Answers: 1
Do you know the correct answer?
Step 1: Collect and organize your data. Using the Super Survey Simulator, survey 10 students of your...
Questions in other subjects:


English, 27.07.2021 07:10

Mathematics, 27.07.2021 07:10
Mathematics, 27.07.2021 07:10


