


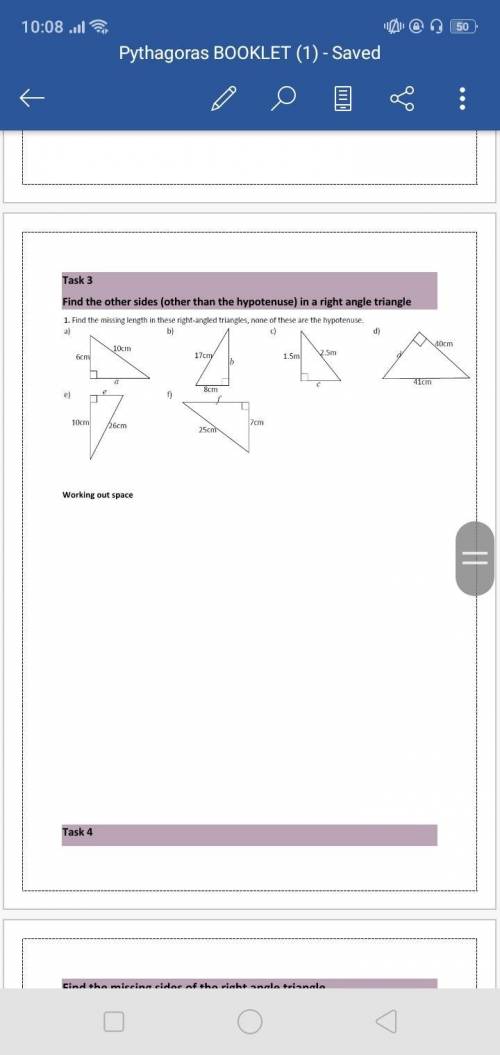
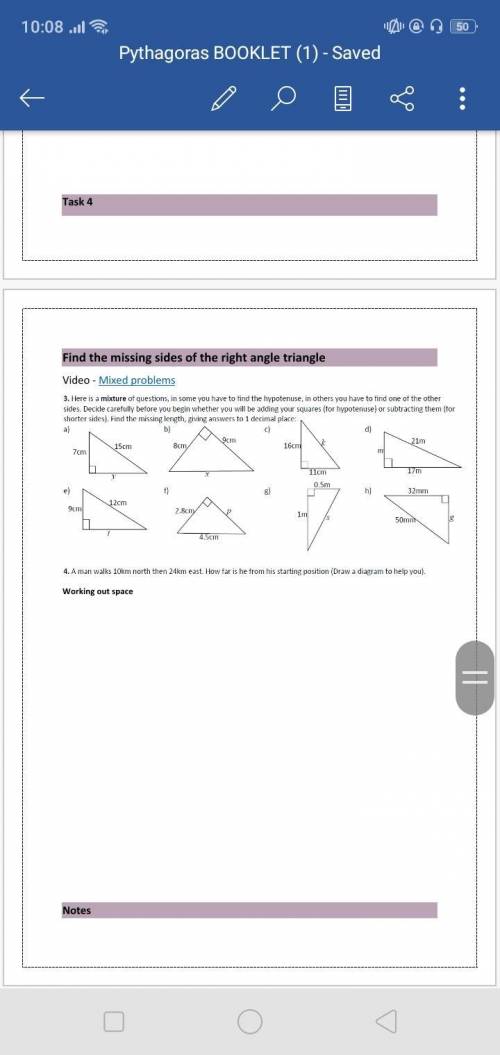
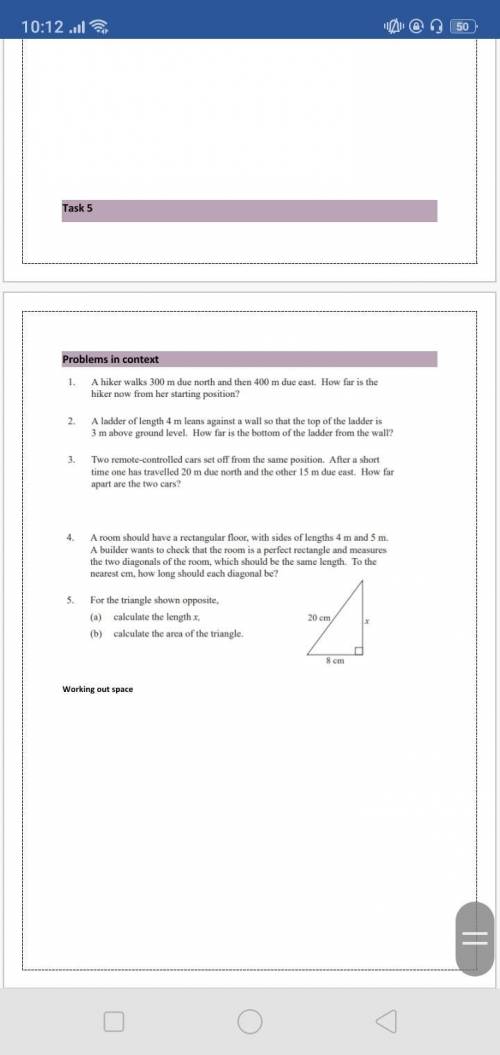
If someone is good in theoram please help me I need help with task 3,4,5
...

Mathematics, 20.09.2020 09:01, miguelmike2895
If someone is good in theoram please help me I need help with task 3,4,5

Answers: 1
Other questions on the subject: Mathematics
Mathematics, 21.06.2019 20:30, nosugh
If m∠abc = 70°, what is m∠abd? justify your reasoning. using the addition property of equality, 40 + 70 = 110, so m∠abd = 110°. using the subtraction property of equality, 70 − 30 = 40, so m∠abd = 30°. using the angle addition postulate, 40 + m∠abd = 70. so, m∠abd = 30° using the subtraction property of equality. using the angle addition postulate, 40 + 70 = m∠abd. so, m∠abd = 110° using the addition property of equality.
Answers: 2
Mathematics, 21.06.2019 21:00, moneybaggzay123
X+y=-4 x-y=2 use elimination with adding and subtraction
Answers: 3
Do you know the correct answer?
Questions in other subjects:
Mathematics, 27.08.2019 19:30


English, 27.08.2019 19:30


Biology, 27.08.2019 19:30
Social Studies, 27.08.2019 19:30

Chemistry, 27.08.2019 19:30


