

Mathematics, 20.09.2020 02:01, avagracesmith5
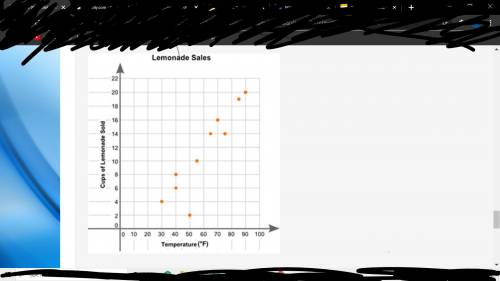
06.02)Eric plotted the graph below to show the relationship between the temperature of his city and the number of cups of lemonade he sold daily: A scatter plot is shown with the title Lemonade Sales. The x-axis is labeled High Temperature, and the y-axis is labeled Cups of Lemonade Sold. Data points are located at 30 and 4, 40 and 6, 40 and 8, 50 and 2, 55 and 10, 65 and 14, 70 and 16, 75 and 14, 85 and 19, 90 and 20. Part A: Describe the relationship between the temperature of the city and the number of cups of lemonade sold. (2 points) Part B: Describe how you can make the line of best fit. Write the approximate slope and y-intercept of the line of best fit. Show your work, including the points that you use to calculate the slope and y-intercept. (3 points)

Answers: 2


Other questions on the subject: Mathematics
Mathematics, 21.06.2019 19:30, estherstlouis7812
1. find the area of the unshaded square 2. find the area of the large square 3. what is the area of the frame represented by the shaded region show
Answers: 1
Mathematics, 22.06.2019 01:30, yennifervilleda05
The water aquarium shark tank is always greater than 25 feet of the water level decreased by 6 feet during cleaning what was the water level before the cleaners took out any water
Answers: 1
Do you know the correct answer?
06.02)Eric plotted the graph below to show the relationship between the temperature of his city and...
Questions in other subjects:
Mathematics, 06.06.2020 13:57

Physics, 06.06.2020 13:57

Business, 06.06.2020 13:57
Mathematics, 06.06.2020 13:57

English, 06.06.2020 13:57

Mathematics, 06.06.2020 13:58


