

Mathematics, 19.09.2020 01:01, Ezekielcassese
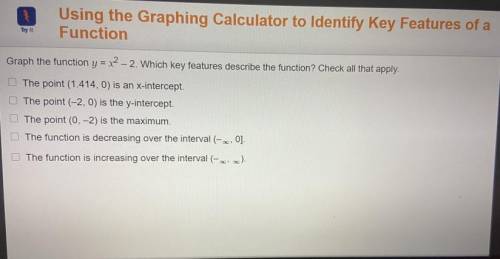
Graph the function y = x2 - 2. Which key features describe the function? Check all that apply.
The point (1.414, 0) is an x-intercept.
The point (-2, 0) is the y-intercept.
The point (0, -2) is the maximum.
The function is decreasing over the interval (- 0, 0].
The function is increasing over the interval (-a, o).

Answers: 1


Other questions on the subject: Mathematics
Mathematics, 21.06.2019 21:30, lainnn974
Questions 7-8. use the following table to answer. year 2006 2007 2008 2009 2010 2011 2012 2013 cpi 201.6 207.342 215.303 214.537 218.056 224.939 229.594 232.957 7. suppose you bought a house in 2006 for $120,000. use the table above to calculate the 2013 value adjusted for inflation. (round to the nearest whole number) 8. suppose you bought a house in 2013 for $90,000. use the table above to calculate the 2006 value adjusted for inflation. (round to the nearest whole number)
Answers: 3
Mathematics, 21.06.2019 22:00, LuckyCharms988
What is the solution to the equation e3x=12? round your answer to the nearest hundredth
Answers: 1
Mathematics, 21.06.2019 22:30, brooklyn4932
1.based of the diagrams what is the the value of x? 2.how would you verify your answer for x
Answers: 1
Do you know the correct answer?
Graph the function y = x2 - 2. Which key features describe the function? Check all that apply.
The...
Questions in other subjects:

History, 28.10.2019 02:31

Law, 28.10.2019 02:31
Mathematics, 28.10.2019 02:31

Chemistry, 28.10.2019 02:31
Chemistry, 28.10.2019 02:31


