

Mathematics, 09.09.2020 23:01, jessica112776
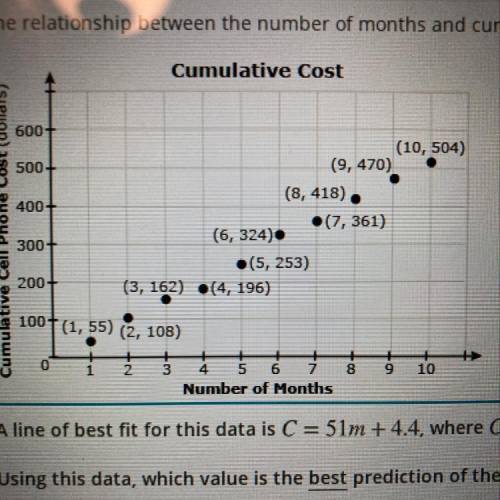
The relationship between the number of months and cumulative cell phone cost is represented by the scatter plot shown. A line of best fit for this data is C=51m+4.4, where C is the cumulative cell phone cost and m is the number of months. Using this data which value is the best prediction of the cumulative cell phone cost after 18 months?
A.)$918
B.)$923
C.)$940
D.)$990

Answers: 3


Other questions on the subject: Mathematics
Mathematics, 21.06.2019 20:00, raularriaga
You have 138.72 in your saving account u take out 45.23 and 18.00 you deposit 75.85 into your account
Answers: 1
Mathematics, 21.06.2019 21:00, moneybaggzay123
X+y=-4 x-y=2 use elimination with adding and subtraction
Answers: 3
Mathematics, 21.06.2019 22:10, markayla101326
In which direction does the left side of the graph of this function point? f(x) = 3x3 - x2 + 4x - 2
Answers: 2
Mathematics, 21.06.2019 23:00, erbnichole
Graph the system of equations on your graph paper to answer the question. {y=−x+4y=x−2 what is the solution for the system of equations? enter your answer in the boxes.
Answers: 1
Do you know the correct answer?
The relationship between the number of months and cumulative cell phone cost is represented by the s...
Questions in other subjects:
Mathematics, 08.02.2021 22:00
Mathematics, 08.02.2021 22:00


Chemistry, 08.02.2021 22:00

English, 08.02.2021 22:00


