Mathematics, 03.09.2020 23:01, melaniegilbreath
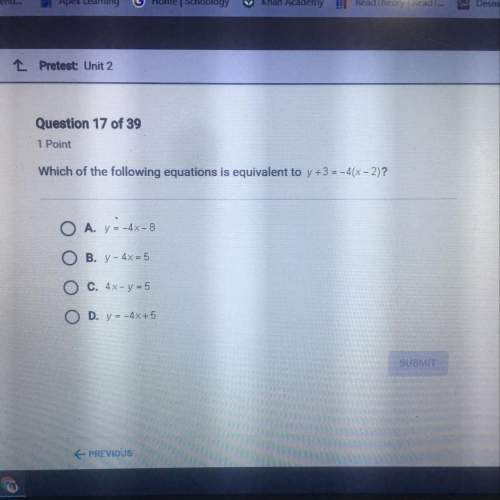
Timothy Tools is a company that produces hand-crafted hammers and wrenches. The following equation can be used to determine how many hammers the company can produce each day if x people are making hammers. The following graph can be used to determine how many wrenches the company can produce each day if x people are making wrenches. Which of the following statements is true?

Answers: 3
Other questions on the subject: Mathematics

Mathematics, 21.06.2019 13:50, jungcoochie101
Aman steps out of a plane at a height of 4,000m above the ground falls 2,000m very quickly and then opens his parachute and slowly falls the remaining 2000m to the ground what height above the ground would be the best choice for a reference point
Answers: 2

Mathematics, 21.06.2019 16:00, kell22wolf
Part one: measurements 1. measure your own height and arm span (from finger-tip to finger-tip) in inches. you will likely need some from a parent, guardian, or sibling to get accurate measurements. record your measurements on the "data record" document. use the "data record" to you complete part two of this project. name relationship to student x height in inches y arm span in inches archie dad 72 72 ginelle mom 65 66 sarah sister 64 65 meleah sister 66 3/4 67 rachel sister 53 1/2 53 emily auntie 66 1/2 66 hannah myself 66 1/2 69 part two: representation of data with plots 1. using graphing software of your choice, create a scatter plot of your data. predict the line of best fit, and sketch it on your graph. part three: the line of best fit include your scatter plot and the answers to the following questions in your word processing document 1. 1. which variable did you plot on the x-axis, and which variable did you plot on the y-axis? explain why you assigned the variables in that way. 2. write the equation of the line of best fit using the slope-intercept formula $y = mx + b$. show all your work, including the points used to determine the slope and how the equation was determined. 3. what does the slope of the line represent within the context of your graph? what does the y-intercept represent? 5. use the line of best fit to you to describe the data correlation.
Answers: 2

Mathematics, 21.06.2019 17:30, Hilljos018
The length of triangle base is 26. a line, which is parallel to the base divides the triangle into two equal area parts. find the length of the segment between triangle legs.
Answers: 3

Mathematics, 21.06.2019 19:20, hahah265
Suppose that a households monthly water bill (in dollars) is a linear function of the amount of water the household uses (in hundreds of cubic feet, hcf). when graphed, the function gives a line with slope of 1.65. if the monthly cost for 13 hcf is $46.10 what is the monthly cost for 19 hcf?
Answers: 3
Do you know the correct answer?
Timothy Tools is a company that produces hand-crafted hammers and wrenches. The following equation c...
Questions in other subjects:


Social Studies, 16.01.2020 01:31

Chemistry, 16.01.2020 01:31


Chemistry, 16.01.2020 01:31

History, 16.01.2020 01:31


