


Assignment
Active
Practice analyzing quantitative relationships.
Assignment
Which...

Mathematics, 03.09.2020 22:01, anaoliviahoy
Assignment
Active
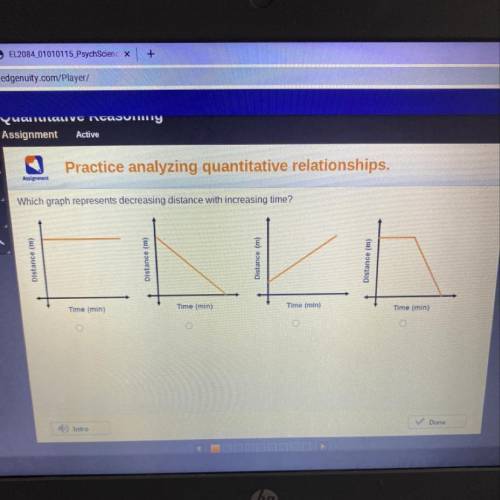
Practice analyzing quantitative relationships.
Assignment
Which graph represents decreasing distance with increasing time?
Distance (m)
* Distance (m)
Distance (m)
Distance (m)
Time (min)
Time (min)
Time (min)
Time (min)
o

Answers: 1
Other questions on the subject: Mathematics
Mathematics, 21.06.2019 19:40, nancy00
Aretha wanted to gather data about the cost of local bowling leagues in her area. she plotted the data and determined that the average bowling league costs consist of a one-time registration fee and a monthly fee modeled by the equation y = 15x + 20. identify and interpret the y-intercept in this model. the y-intercept is 20. this is the cost per month. the y-intercept is 20. this is the cost of registration. the y-intercept is 15. this is the cost of registration. the y-intercept is 15. this is the cost per month.
Answers: 1
Mathematics, 21.06.2019 23:00, ambercuevas2707
Jorge wants to determine the enlarged dimensions of a digital photo to be used as wallpaper on his computer screen. the original photo was 800 pixels wide by 600 pixels high. the new photo will be 1,260 pixels wide. what will the new height be?
Answers: 1
Mathematics, 22.06.2019 00:30, aylineorozco836
If m_b=mzd= 43, find mzc so that quadrilateral abcd is a parallelogram o 86 137 o 129 43 description
Answers: 1
Do you know the correct answer?
Questions in other subjects:

Mathematics, 22.08.2020 09:01
Mathematics, 22.08.2020 09:01

English, 22.08.2020 09:01

Physics, 22.08.2020 09:01


