Which of the following best describes the graph below? + + 2 + 3 + 4 1 o a. it is not a function. o b. it is a one-to-one function. o c. it is a many-to-one function. o d. it is a function, but it is not one-to-one.
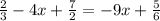
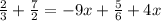
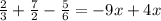
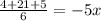
One x-intercept for a parabola is at the point (-0.33,0). use the quadratic formula to find the other x-intercept for the parabola defined by the equation y=-3x^2+5x+2