

Mathematics, 03.09.2020 03:01, HarryPotter10
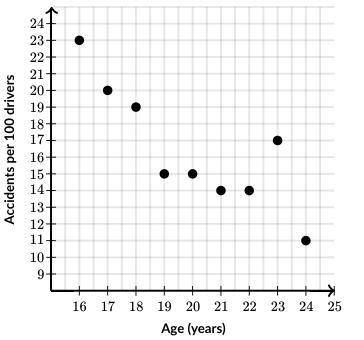
The graph shown below shows the relationship between the age of drivers and the number of car accidents per 100 drivers in the year 2009. What is the best description of this relationship?

Answers: 1


Other questions on the subject: Mathematics
Mathematics, 22.06.2019 03:30, siriuskitwilson9408
The half-life of a certain material is 0.002 second. approximately how much of a 14-gram sample will be left after 0.004 second? a. 12 grams b. 3.5 grams c. 0.06 gram d. 7 grams
Answers: 1
Do you know the correct answer?
The graph shown below shows the relationship between the age of drivers and the number of car accide...
Questions in other subjects:

History, 21.09.2020 02:01


History, 21.09.2020 02:01

Spanish, 21.09.2020 02:01
Physics, 21.09.2020 02:01
Spanish, 21.09.2020 02:01


