

Mathematics, 01.09.2020 23:01, kaylijocombs
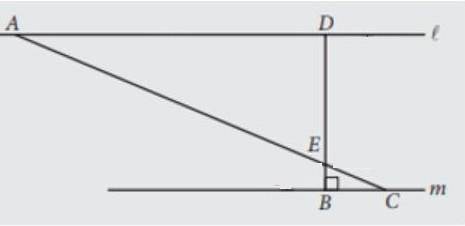
Given: In the figure below, line l is parallel to line m, segment BD is perpendicular to line m, and segment AC and segment BD intersect at E. What can you prove about triangles ADE and CBE? Use angle relationships and triangle theorems to explain how you know.

Answers: 2


Other questions on the subject: Mathematics
Mathematics, 21.06.2019 17:30, cocothunder635
The manufacturer of a new product developed the following expression to predict the monthly profit, in thousands of dollars, from sales of the productwhen it is sold at a unit price of x dollars.-0.5x^2 + 22x - 224what is represented by the zero(s) of the expression? a. the profit when the unit price is equal to 0b. the unit price(s) when the profit is equal to 0c. the profit when the unit price is greatestd. the unit price(s) when profit is greatest
Answers: 3
Mathematics, 21.06.2019 21:30, neptunesx
Students are given 3 minutes to complete each multiple-choice question on a test and 8 minutes for each free-responsequestion. there are 15 questions on the test and the students have been given 55 minutes to complete itwhich value could replace x in the table? 5507-m23-m8(15-m)8(15)-m
Answers: 2
Mathematics, 22.06.2019 02:00, mathhelppls14
1. the manager of collins import autos believes the number of cars sold in a day (q) depends on two factors: (1) the number of hours the dealership is open (h) and (2) the number of salespersons working that day (s). after collecting data for two months (53 days), the manager estimates the following log-linear model: q 4 equation 1 a. explain, how to transform the log-linear model into linear form that can be estimated using multiple regression analysis. the computer output for the multiple regression analysis is shown below: q4 table b. how do you interpret coefficients b and c? if the dealership increases the number of salespersons by 20%, what will be the percentage increase in daily sales? c. test the overall model for statistical significance at the 5% significance level. d. what percent of the total variation in daily auto sales is explained by this equation? what could you suggest to increase this percentage? e. test the intercept for statistical significance at the 5% level of significance. if h and s both equal 0, are sales expected to be 0? explain why or why not? f. test the estimated coefficient b for statistical significance. if the dealership decreases its hours of operation by 10%, what is the expected impact on daily sales?
Answers: 2
Mathematics, 22.06.2019 04:00, GodlyGamer8239
Write a function rule for “the output is 5 less than the input.” let xx be the input and let yy be the output.
Answers: 3
Do you know the correct answer?
Given: In the figure below, line l is parallel to line m, segment BD is perpendicular to line m, and...
Questions in other subjects:

English, 05.03.2021 21:10
Mathematics, 05.03.2021 21:10


History, 05.03.2021 21:10

Biology, 05.03.2021 21:10
Mathematics, 05.03.2021 21:10
Mathematics, 05.03.2021 21:10


