


Which of the following functions best describes this graph?
A. y = x2 -5x + 6
B. y = (x - 1...

Mathematics, 02.09.2020 04:01, lexus1427
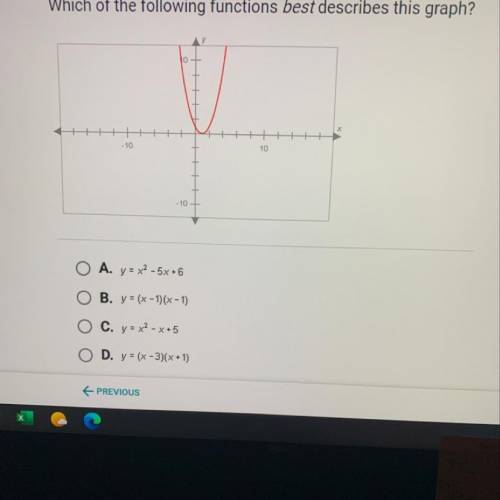
Which of the following functions best describes this graph?
A. y = x2 -5x + 6
B. y = (x - 1)(x - 1)
C. y = x2 - x +5
D. y = (x - 3)(x + 1)

Answers: 3
Other questions on the subject: Mathematics
Mathematics, 21.06.2019 16:10, DepressionCentral
Which of the following graphs represents the function f(x) = 2^x
Answers: 2
Mathematics, 21.06.2019 18:00, joseroblesrivera123
Since opening night, attendance at play a has increased steadily, while attendance at play b first rose and then fell. equations modeling the daily attendance y at each play are shown below, where x is the number of days since opening night. on what day(s) was the attendance the same at both plays? what was the attendance? play a: y = 8x + 191 play b: y = -x^2 + 26x + 126
Answers: 1
Mathematics, 21.06.2019 19:30, zetrenne73
Jada has a meal in a restaurant she adds up the prices listed on the menu for everything they ordered and gets a subtotal of $42.00. when the check comes, it says they also need to pay $3.99 in sales tax. what percentage of the subtotal is the sales tax
Answers: 2
Do you know the correct answer?
Questions in other subjects:


