

Mathematics, 31.08.2020 01:01, Valduarte07
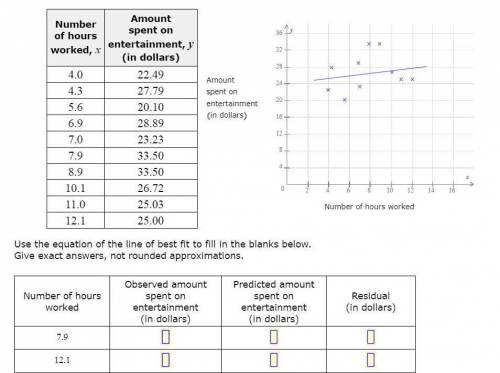
The table and scatter plot show the number of hours worked, x , and the amount of money spent on entertainment, y, by each of 10 students. The equation of the line of best fit is y=0.3x+24.00 Use the equation of the line of best fit to fill in the blanks below. Give exact answers, not rounded approximations.

Answers: 1


Other questions on the subject: Mathematics
Mathematics, 21.06.2019 21:50, Hali07
Determine the common ratio and find the next three terms of the geometric sequence. 10, 2, 0.4, a. 0.2; -0.4, -2, -10 c. 0.02; 0.08, 0.016, 0.0032 b. 0.02; -0.4, -2, -10 d. 0.2; 0.08, 0.016, 0.0032 select the best answer from the choices provided a b c d
Answers: 1
Mathematics, 21.06.2019 23:30, ashiteru123
The average daily maximum temperature for laura’s hometown can be modeled by the function f(x)=4.5sin(πx/6)+11.8 , where f(x) is the temperature in °c and x is the month. x = 0 corresponds to january. what is the average daily maximum temperature in may? round to the nearest tenth of a degree if needed. use 3.14 for π .
Answers: 1
Do you know the correct answer?
The table and scatter plot show the number of hours worked, x , and the amount of money spent on ent...
Questions in other subjects:


Mathematics, 23.04.2021 17:10
Mathematics, 23.04.2021 17:10

Mathematics, 23.04.2021 17:20
History, 23.04.2021 17:20


