

Mathematics, 28.08.2020 01:01, Kzamor
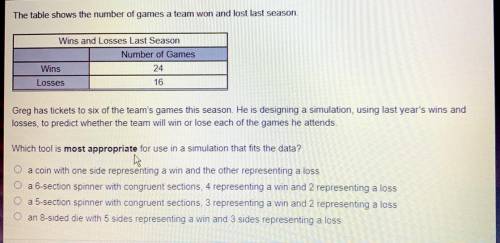
Greg has tickets to six of the team's games this season. He is designing a simulation, using last year's wins and
losses, to predict whether the team will win or lose each of the games he attends.
Which tool is most appropriate for use in a simulation that fits the data?
O a coin with one side representing a win and the other representing a loss
O a 6-section spinner with congruent sections, 4 representing a win and 2 representing a loss
a 5-section spinner with congruent sections, 3 representing a win and 2 representing a loss
O an 8-sided die with 5 sides representing a win and 3 sides representing a loss

Answers: 3


Other questions on the subject: Mathematics
Mathematics, 21.06.2019 20:30, violetagamez2
Answer for 10 points show work you guys in advanced < 3
Answers: 1
Mathematics, 21.06.2019 23:30, reycaden
The number of members f(x) in a local swimming club increased by 30% every year over a period of x years. the function below shows the relationship between f(x) and x: f(x) = 10(1.3)xwhich of the following graphs best represents the function? graph of f of x equals 1.3 multiplied by 10 to the power of x graph of exponential function going up from left to right in quadrant 1 through the point 0, 0 and continuing towards infinity graph of f of x equals 10 multiplied by 1.3 to the power of x graph of f of x equals 1.3 to the power of x
Answers: 1
Do you know the correct answer?
Greg has tickets to six of the team's games this season. He is designing a simulation, using last ye...
Questions in other subjects:

Biology, 15.12.2019 10:31
Mathematics, 15.12.2019 10:31
Biology, 15.12.2019 10:31


Mathematics, 15.12.2019 10:31

Mathematics, 15.12.2019 10:31

History, 15.12.2019 10:31


