

Mathematics, 25.08.2020 21:01, alee885
M 1
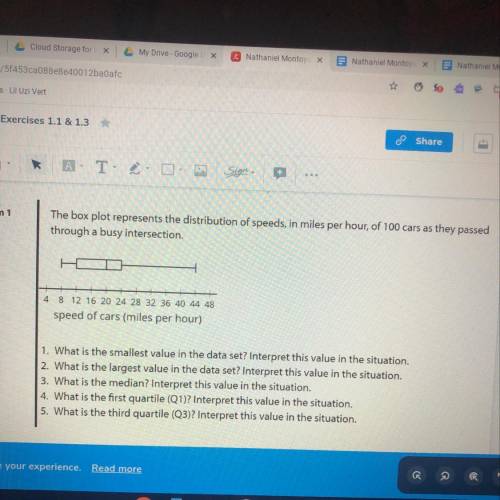
The box plot represents the distribution of speeds, in miles per hour, of 100 cars as they passed
through a busy intersection.
4
8 12 16 20 24 28 32 36 40 44 48
speed of cars (miles per hour)
1. What is the smallest value in the data set? Interpret this value in the situation.
2. What is the largest value in the data set? Interpret this value in the situation.
3. What is the median? Interpret this value in the situation.
4. What is the first quartile (Q1)? Interpret this value in the situation.
5. What is the third quartile (Q3)? Interpret this value in the situation.

Answers: 1


Other questions on the subject: Mathematics
Mathematics, 22.06.2019 00:00, kenzielema12
Suppose that g(x)=f(x+9) which statement best compares the graph of g(x) with the graph of f(x)
Answers: 3
Do you know the correct answer?
M 1
The box plot represents the distribution of speeds, in miles per hour, of 100 cars as they pass...
Questions in other subjects:
Mathematics, 16.12.2020 14:00


History, 16.12.2020 14:00

Arts, 16.12.2020 14:00
History, 16.12.2020 14:00


