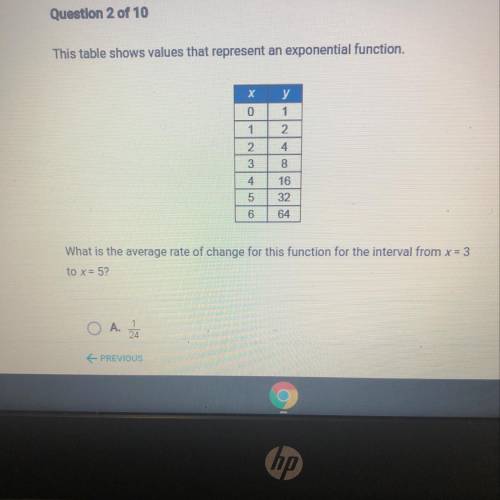
This table shows values that represent an exponential function.
х
0
у
1
2
4
1
2
3
8
4
16
32
5
6
64
What is the average rate of change for this function for the interval from x= 3
to x= 5?
Margaret is purchasing a house for $210,000 with a 15 year fixed rate mortgage at 4.75% interest she has made a 5% down payment the house is valued at 205,000 and the local tax rate is 3.5% homeowners insurance 600 per year what are her total monthly payment