

Mathematics, 20.08.2020 01:01, shaelyn0920
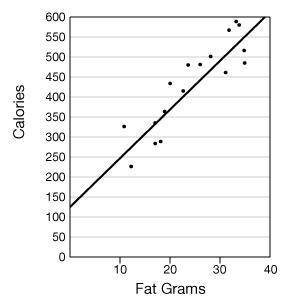
100 POINTS! WILL MARK BRAINLIEST. NEED HELP BAD. 1. Collect data from several fast food chains on the number of fat calories and grams of saturated fat in menu items. Record at least 12 ordered pairs of (fat calories, grams of saturated fat). Organize your data in a table. 2. Make a scatter plot of the data on graph paper. Be sure to label the axes and use an appropriate title for the graph. You may wish to use a graphing calculator, spread sheet, or other technology resource (such as the graphing utility link below) to aid you in graphing. Create a Graph 3. Draw a trend line for the scatter plot. Use the following scatter plot of the ordered pairs (fat grams, total calories) as an example. 4. Calculate the slope of the trend line. (Choose two points on the line and find vertical change over horizontal change.) Note: Graphing calculators and spread sheets have features with which to draw trend lines and determine the equation. You may choose to use one of these options. If you use technology, indicate what steps were taken to arrive at your equation. 5. Using the slope and y-intercept, write the equation of the trend line ( y = mx + b). 6. Choose a "calories from fat" value that is not in your collected data set and that is at least 10 fat calories away from any collected value. Use the equation calculated in step 5 to predict the number of fat grams in an item having that number of fat calories. Be sure to show your work. 7. Search for an item in a fast food menu having the same number of fat calories as the one you chose above. (If you cannot find the exact value, get as close as you can.) Compare the calculated value from step 6 to this actual value. Explain why (or why not) you would have expected your prediction (calculated value) to be close to the actual value.

Answers: 2


Other questions on the subject: Mathematics
Mathematics, 21.06.2019 16:00, ashleyd9243
What is the standard deviation of the following data set rounded to the nearest tenth? 3, 17, 18, 15, 12, 21, 9
Answers: 2
Mathematics, 21.06.2019 18:50, umarhaley
The avenues in a particular city run north to south and are numbered consecutively with 1st avenue at the western border of the city. the streets in the city run east to west and are numbered consecutively with 1st street at the southern border of the city. for a festival, the city is not allowing cars to park in a rectangular region bordered by 5th avenue to the west. 9th avenue to the east, 4th street to the south, and 6th street to the north. if x is the avenue number and yis the street number, which of the following systems describes the region in which cars are not allowed to park? 5th ave 9th ave
Answers: 1
Mathematics, 21.06.2019 19:00, Brendah4962
Solve the equation using the zero-product property. -3n(7n - 5) = 0 a. 0, -5/7 b. -1/3, -5/7 c. -1/3, 5/7 d. 0, 5/7
Answers: 2
Do you know the correct answer?
100 POINTS! WILL MARK BRAINLIEST. NEED HELP BAD. 1. Collect data from several fast food chains on th...
Questions in other subjects:

Mathematics, 27.02.2021 01:00

Physics, 27.02.2021 01:00

Chemistry, 27.02.2021 01:00
Mathematics, 27.02.2021 01:00

Geography, 27.02.2021 01:00
Mathematics, 27.02.2021 01:00


History, 27.02.2021 01:00


