

Mathematics, 17.08.2020 01:01, reinasuarez964
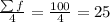
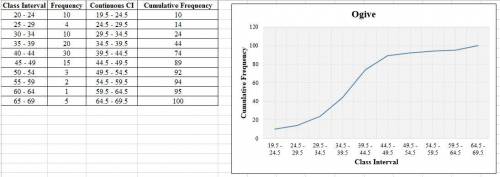
The following table shows scores obtained in an examination by B. Ed JHS Specialism students. Use the information to answer the questions that follow: Score 20-24 25-29 30-34 35-39 40-44 45-49 50-54 55-59 60-64 65-69 Frequency 10 4 10 20 30 15 3 2 1 5.a. Construct a cumulative frequency curve for the data. b. Find the; i. inter-quartile range. ii. 70th percentile class scores. iii. probability that a student scored at most 50 on the examination

Answers: 1
![Q_{1}=l+[\frac{(\sum f/4)-(CF)_{p}}{f}]\times h](/tpl/images/0723/2115/19830.png)
 = cumulative frequency of the previous class = 24
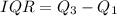
![=34.5+[\frac{25-24}{20}]\times5\\\\=34.5+0.25\\=34.75](/tpl/images/0723/2115/afa09.png)
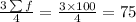
![Q_{3}=l+[\frac{(3\sum f/4)-(CF)_{p}}{f}]\times h](/tpl/images/0723/2115/4a744.png)
![=44.5+[\frac{75-74}{15}]\times5\\\\=44.5+0.33\\=44.83](/tpl/images/0723/2115/0202c.png)


Other questions on the subject: Mathematics
Mathematics, 21.06.2019 15:40, kevenluna10oytivm
What is the first quartile of the data set? 10, 11, 12, 15, 17, 19, 22, 24, 29, 33, 38 a. 12 b. 19 c. 29 d. 10
Answers: 1
Mathematics, 21.06.2019 17:00, zacksoccer8279
Me! last question, and i'm stuck! write the algebraic expression that models the word phrase. the product of 2 divided by the number h and 8 more than the number k
Answers: 1
Mathematics, 21.06.2019 22:40, alialoydd11
Afunction g(x) has x-intercepts at (, 0) and (6, 0). which could be g(x)? g(x) = 2(x + 1)(x + 6) g(x) = (x – 6)(2x – 1) g(x) = 2(x – 2)(x – 6) g(x) = (x + 6)(x + 2)
Answers: 1
Do you know the correct answer?
The following table shows scores obtained in an examination by B. Ed JHS Specialism students. Use th...
Questions in other subjects:

Advanced Placement (AP), 23.10.2020 01:01


English, 23.10.2020 01:01


Biology, 23.10.2020 01:01


