

Mathematics, 17.08.2020 01:01, 120175
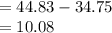
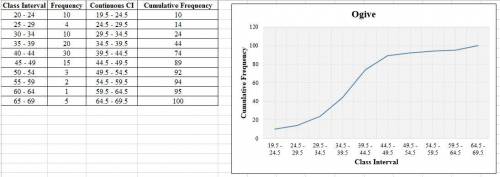
The following table shows scores obtained in an examination by B. Ed JHS Specialism students. Use the information to answer the questions that follow: Score 20-24 25-29 30-34 35-39 40-44 45-49 50-54 55-59 60-64 65-69 Frequency 10 4 10 20 30 15 3 2 1 5.a. Construct a cumulative frequency curve for the data. b. Find the; i. inter-quartile range. ii. 70th percentile class scores. iii. probability that a student scored at most 50 on the examination Please is urgent .can I get help

Answers: 1
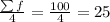
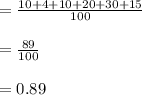
![Q_{1}=l+[\frac{(\sum f/4)-(CF)_{p}}{f}]\times h](/tpl/images/0723/2391/19830.png)
 = cumulative frequency of the previous class = 24
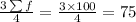
![=34.5+[\frac{25-24}{20}]\times5\\\\=34.5+0.25\\=34.75](/tpl/images/0723/2391/afa09.png)
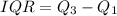
![Q_{3}=l+[\frac{(3\sum f/4)-(CF)_{p}}{f}]\times h](/tpl/images/0723/2391/4a744.png)
![=44.5+[\frac{75-74}{15}]\times5\\\\=44.5+0.33\\=44.83](/tpl/images/0723/2391/0202c.png)


Other questions on the subject: Mathematics
Mathematics, 21.06.2019 19:10, twirlergirl800
If a || b and e || f , what if the value of y ?
Answers: 3
Mathematics, 21.06.2019 20:30, einsigcn8481
Diane’s bank is offering 5% interest, compounded monthly. if diane invests $10,500 and wants $20,000 when she withdrawals, how long should she keep her money in for? round to the nearest tenth of a year.
Answers: 2
Mathematics, 22.06.2019 05:30, jasminelynn135owmyj1
How will you write 5 x 5 x 5 x 5 x 5 as an exponential expression? oa. 5x5 ob. 55 oc. 545 od. 5 reset next
Answers: 3
Do you know the correct answer?
The following table shows scores obtained in an examination by B. Ed JHS Specialism students. Use th...
Questions in other subjects:


Mathematics, 21.11.2019 06:31


