

Mathematics, 12.08.2020 08:01, ks970065
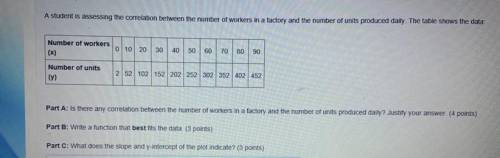
A student is assessing the correlation between the number of workers in a factory and the number of units produced daily. The table shows the data: GRAPH IS LOCATED IN PICTURES! Part A: Is there any correlation between the number of workers in a factory and the number of units produced daily? Justify your answer. (4 points) Part B: Write a function that best fits the data. (3 points) Part C: What does the slope and y-intercept of the plot indicate? (3 points)

Answers: 3


Other questions on the subject: Mathematics
Mathematics, 21.06.2019 15:30, southerntouch103
Gretchen is setting up for a banquet. she has 300 chairs and needs to distribute them evenly among t tables. how many chairs should she put at each table? write your answer as an expression.
Answers: 2
Mathematics, 21.06.2019 23:00, firefightergros7271
Match the vocabulary to the proper definition. in probability, two events in which 1. conditional probability the outcome of one event is independent of the outcome of a second event. 2. dependent events in probability, two events in which the outcome of one event is dependent on the outcome of a second event. the probability of an event in which the outcome of the event is conditional on the outcome of one or more different events. 3. independent events
Answers: 2
Do you know the correct answer?
A student is assessing the correlation between the number of workers in a factory and the number of...
Questions in other subjects:


Mathematics, 31.08.2019 21:30

Physics, 31.08.2019 21:30


