

Mathematics, 12.08.2020 07:01, Jojo3915
HELLP In this task, you will practice finding the area under a nonlinear function by using rectangles. You will use graphing skills in addition to the knowledge gathered in this unit. Sketch the graph of the function y = 20x − x2, and approximate the area under the curve in the interval [0, 20] by dividing the area into the given numbers of rectangles. part a Use five rectangles to approximate the area under the curve. part b Use 10 rectangles to approximate the area under the curve. part c Calculate the area under the curve using rectangles as their number becomes arbitrarily large (tends to infinity). You do not need to sketch the rectangles.


Answers: 1
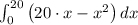
![\int _{0}^{20}\left (20\cdot x - x^{2} \right )dx = \left [\dfrac{20}{2}\cdot x^{2} - \dfrac{x^{3}}{3} \right ]_{0}^{20} = \left [10\cdot x^{2} - \dfrac{x^{3}}{3} \right ]_{0}^{20}](/tpl/images/0719/4179/e8cdd.png)


Other questions on the subject: Mathematics
Mathematics, 21.06.2019 15:00, denisebaslee15
Of four points are collinear, they are also coplanar
Answers: 2
Mathematics, 21.06.2019 17:30, 4presidents
Tom wants to order tickets online so that he and three of his friends can go to a water park the cost of the tickets is 16.00 per person there is also a 2.50 one-time service fee for ordering tickets online write an expression in term of n that represents the cost for n ordering tickets online
Answers: 1
Mathematics, 21.06.2019 18:30, FailingstudentXD
Do some research and find a city that has experienced population growth. determine its population on january 1st of a certain year. write an exponential function to represent the city’s population, y, based on the number of years that pass, x after a period of exponential growth. describe the variables and numbers that you used in your equation.
Answers: 3
Mathematics, 21.06.2019 20:00, faithyholcomb
Someone answer asap for ! max recorded the heights of 500 male humans. he found that the heights were normally distributed around a mean of 177 centimeters. which statements about max’s data must be true? a. the median of max’s data is 250 b. more than half of the data points max recorded were 177 centimeters. c. a data point chosen at random is as likely to be above the mean as it is to be below the mean. d. every height within three standard deviations of the mean is equally likely to be chosen if a data point is selected at random.
Answers: 1
Do you know the correct answer?
HELLP In this task, you will practice finding the area under a nonlinear function by using rectangle...
Questions in other subjects:

History, 08.10.2019 08:30
Mathematics, 08.10.2019 08:30


History, 08.10.2019 08:30
Mathematics, 08.10.2019 08:30


