

Mathematics, 12.08.2020 07:01, eboniwiley
The graph below shows the relationship between the number of months different students practiced baseball and the number of games they won:
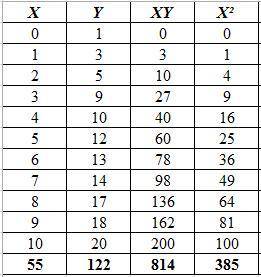
The title of the graph is Baseball Games. On x axis, the label is Number of Months of Practice. On y axis, the label is Number of Games Won. The scale on the y axis is from 0 to 22 at increments of 2, and the scale on the x axis is from 0 to 12 at increments of 2. The points plotted on the graph are the ordered pairs 0, 1 and 1, 3 and 2, 5 and 3, 9 and 4, 10 and 5, 12 and 6, 13 and 7, 14 and 8,17 and 9, 18 and 10,20. A straight line is drawn joining the ordered pairs 0, 1.8 and 2, 5.6 and 4, 9.2 and 6, 13 and 8, 16.5 and 10, 20.5.
Part A: What is the approximate y-intercept of the line of best fit and what does it represent? (5 points)
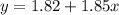
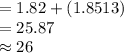
Part B: Write the equation for the line of best fit in slope-intercept form and use it to predict the number of games that could be won after 13 months of practice. Show your work and include the points used to calculate the slope. (5 points)

Answers: 3


Other questions on the subject: Mathematics
Mathematics, 21.06.2019 22:00, nijanicole164
Out of 50 students surveyed, 16 have a dog. based on these results, predict how many of the 280 students in the school have a dog.
Answers: 2
Do you know the correct answer?
The graph below shows the relationship between the number of months different students practiced bas...
Questions in other subjects:


