

Mathematics, 05.08.2020 16:01, autumperry682
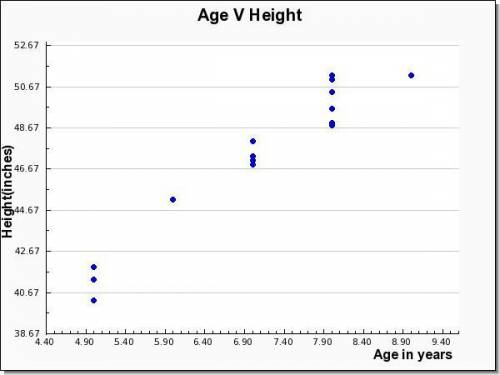
A research center is interested in investigating the height and age of children who are between 5 to 9 years old. In order to do this, a sample of 15 children is selected and the data are given below.
Age (in years) Height (inches)
7 47.3
8 48.8
5 41.3
8 50.4
8 51
7 47.1
7 46.9
7 48
9 51.2
8 51.2
5 40.3
8 48.9
6 45.2
5 41.9
8 49.6
Requried:
a. Develop a scatter chart with age as the independent variable. What does the scatter chart indicate about the relationship between the height and age of children?
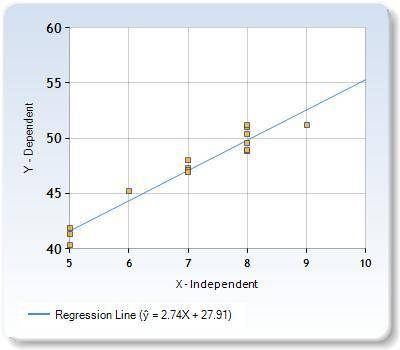
b. Use the data to develop an estimated regression equation that could be used to estimate the height based on the age. What is the estimated regression model?
c. How much of the variation in the sample values of height does the model estimated in part (b) explain?

Answers: 1


Other questions on the subject: Mathematics
Mathematics, 21.06.2019 17:30, wwesuplexcity28
33% of college students say they use credit cards because of the rewards program. you randomly select 10 college students and ask each to name the reason he or she uses credit cards. find the probability that the number of college students who say they use credit cards because of the rewards program is (a) exactly two, (b) more than two, and (c) between two and five inclusive. if convenient, use technology to find the probabilities.
Answers: 1
Mathematics, 21.06.2019 18:00, alyssahomeworkneeds
When the ball has traveled a distance of
Answers: 1
Mathematics, 21.06.2019 20:00, anabelleacunamu
Find the value of x. round the length to the nearest tenth
Answers: 1
Do you know the correct answer?
A research center is interested in investigating the height and age of children who are between 5 to...
Questions in other subjects:
Mathematics, 06.01.2021 01:00


Health, 06.01.2021 01:00
Mathematics, 06.01.2021 01:00

History, 06.01.2021 01:00


