

Mathematics, 12.08.2020 06:01, artiomtyler007
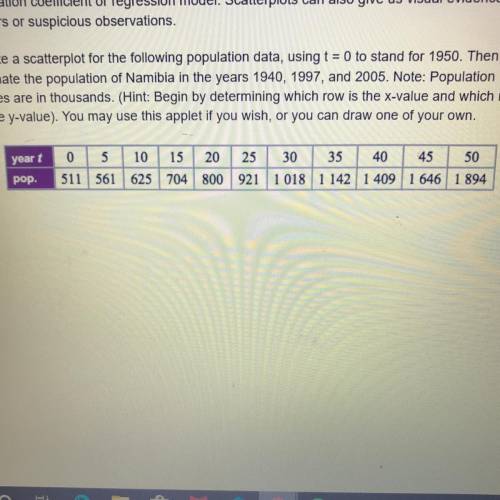
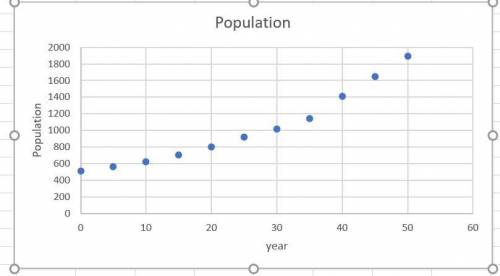
Create a scatterplot for the following population data, using t = 0 to stand for 1950. Then
estimate the population of Namibia in the years 1940, 1997, and 2005. Note: Population
values are in thousands. (Hint: Begin by determining which row is the x-value and which row
is the y-value)

Answers: 2


Other questions on the subject: Mathematics
Mathematics, 21.06.2019 13:30, iicekingmann
What value of x is in the solution set of –5x – 15 > 10 + 20x?
Answers: 1
Mathematics, 21.06.2019 21:00, ShahinF7536
Graph the equationy=x^2 -[tex]y = x^{2} - 2[/tex]
Answers: 1
Do you know the correct answer?
Create a scatterplot for the following population data, using t = 0 to stand for 1950. Then
estimat...
Questions in other subjects:
Mathematics, 04.11.2020 02:40
Mathematics, 04.11.2020 02:40


Mathematics, 04.11.2020 02:40

English, 04.11.2020 02:40

Mathematics, 04.11.2020 02:40


